What was the first technology for recording music: CDs? Records? 78s, The phonograph? No. Trained songbirds came before all of them.
Composer, musician, engineer and visiting fellow at Goldsmiths University, Sarah Angliss, usually has a robot on stage performing live with her. These robots are not slick high tech cyber-beings, but junk modelled automata. One, named Hugo, sports a spooky ventriloquist dolls head! Sarah builds and programs her robots, herself.
She is also a sound historian, and worked on a Radio 4 documentary, ‘The Bird Fancyer’s Delight‘, uncovering how birds have been used to provide music across the ages. During the 1700’s people trained songbirds to sing human invented tunes in their homes. You could buy special manuals showing how to train your pet bird. By playing young birds a tune over and over again, and in the absence of other birds to put them right, they would adopt that song as their own. Playing the recorder was one way to train them, but special instruments were also invented to do the job automatically.
With the invention of the phonograph, home songbird popularity plummeted but it didn’t completely die out. Blackbirds, thrushes, canaries, budgies, bullfinches and other songbirds have continued to be schooled to learn songs that they would never sing in the wild.
Website whimsy 1 – the UK Government (surprisingly)!
If you’re reading this post today (Monday 26th August 2024) it’s a Bank Holiday in England & Wales and in Northern Ireland. The UK Government’s website has a page https://www.gov.uk/bank-holidays which lists all the upcoming dates for the next two years’ worth of bank holidays (so people can put them in the diaries). But… if you visit the page on a Bank Holiday then you’ll be met with some bunting, which isn’t there on the other days. If you’re reading this post tomorrow then you’ll have to wait until the next Bank Holidays, which are Christmas, Boxing Day then New Year’s Day. On those days the bunting changes to tinsel!
Website whimsy 2 – Wikipedia
Throughout history people have tried to make money and sometimes they do so rather dishonestly. Occasionally people claim that they have a qualification in a subject – in the hope that this will make people trust them, and give them money.
Normally it takes time and effort to get a genuine qualification (and for some qualifications it costs money too). A qualification that is suspiciously easy to get (just make a payment and then get a certificate) raises red flags and if someone thinks someone else’s qualification might be fraudulent there’s a fun way they can draw attention to this.
There’s a page on Wikipedia currently called “List of animals awarded human credentials” (but it used to have the even better name “List of animals with fraudulent diplomas” (and before that it was “List of cats with fraudulent diplomas” until people started adding more animals!)). It’s full of examples where people filled in an online form and paid a fee, using their pet’s name as the ‘person’ to be awarded. If someone claims a particular credential but someone else was able to get the same credential for their dog by paying $50 and filling in a form… well, don’t give them any money!
Try your hand at making 3D pictures with stereoscopy
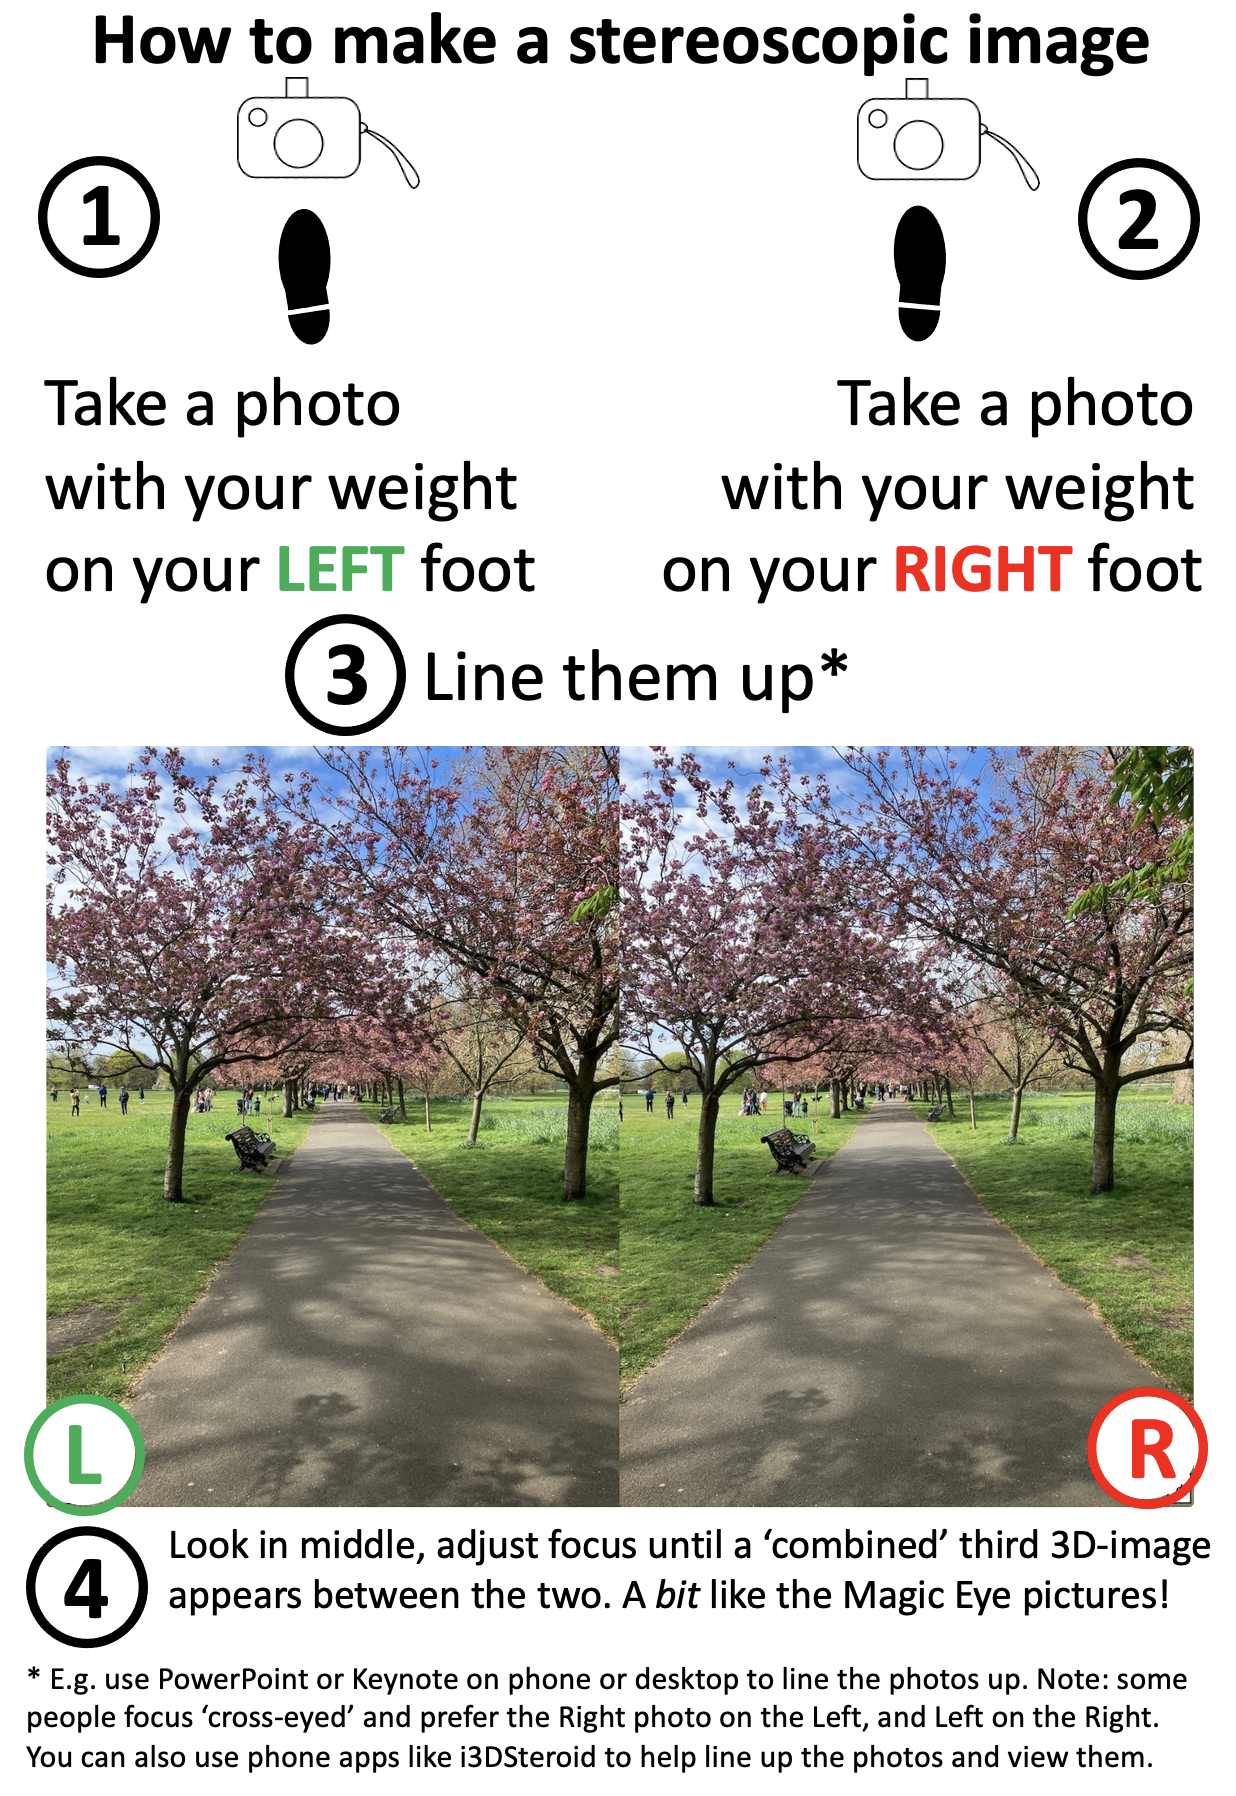
Bank Holiday weather is famous for being inconveniently changeable but if the rain holds off and you’re out and about with a smartphone camera (or any camera) then you can quite easily create some 3D images with them (you can do this indoors too of course). We’ve put together some basic instructions (below) and some more detailed information, in case teachers might also like to try this in class some time. (If the weather is off-putting there are also some ready-to-use images in that link).
Basic instructions: take two photos a few inches apart, line them up, gaze between them and adjust your focus until a third image appears between them which combines the two images into one that has depth perception. This is just recreating what your eyes do naturally every day – combining what your left eye and your right eye see separately into one view of the world around you.
Photographs and icons created by Jo Brodie for CS4FN.
Subscribe to be notified whenever we publish a new post to the CS4FN blog.
This blog is funded by EPSRC on research agreement EP/W033615/1.
The nurse types in a dose of 100.1 mg [milligrams] of a powerful drug and presses start. It duly injects 1001 mg into the patient without telling the nurse that it didn’t do what it was told. You wouldn’t want to be that patient!
Designing a medical device is difficult. It’s not creating the physical machine that causes problems so much as writing the software that controls everything that that machine does. The software is complex and it has to be right. But what do we mean by “right”? The most obvious thing is that when a nurse sets it to do something, that is exactly what it does.
Getting it right is subtler than that though. It must also be easy to use and not mislead the nurse: the human-computer interface has to be right too. It is the software that allows you to interact with a gadget – what buttons you press to get things done and what feedback you are given. There are some basic principles to follow when designing interfaces. One is that the person using it should always be clearly told what it is doing.
Manufacturers need ways to check their devices meet these principles: to know that they got it right.
It’s not just the manufacturers, though. Regulators have the job of checking that machines that might harm people are ‘right’ before they allow them to be sold. That’s really difficult given the software could be millions of lines long. Worse they only have a short time to give an answer.
Million to one chances are guaranteed to happen.
Problems may only happen once in a million times a device is used. They are virtually impossible to find by having someone try possibilities to see what happens, the traditional way software is checked. Of course, if a million devices are bought, then a million to one chance will happen to someone, somewhere almost immediately!
Paolo Masci at Queen Mary University of London, has come up with a way to help and in doing so found a curious problem. He’s been working with the US regulator for medical devices – the FDA – and developed a way to use maths to find problems. It involves creating a mathematical description of what critical parts of the interface program do. Properties, like the user always knowing what is going on, can then be checked using maths. Paolo tried it out on the code for entering numbers of a real medical device and found some subtle problems. He showed that if you typed in certain numbers, the machine actually treated them as a number ten times bigger. Type in a dose of 100.1 and the machine really did set the dose to be 1001. It ignored the decimal point because on such a large dose it assumed small fractions are irrelevant. However another part of the code allows you to continue typing digits. Worse still the device ignores that decimal point silently. It doesn’t make any attempt to help a nurse notice the change. A busy nurse would need to be extremely vigilant to see the tiny decimal point was missing given the lack of warning.
A useful thing about Paolo’s approach is that it gives you the button presses that lead to the problem. With that you can check other devices very quickly. He found that medical devices from three other manufacturers had exactly the same problem. Different teams had all programmed in the same problem. None had thought that if their code ignored a decimal point, it ought to warn the nurse about it rather than create a number ten times bigger. It turns out that different programmers are likely to think the same way and so make the same mistakes (see ‘Double or Nothing‘).
Now the problem is known, nurses can be warned to be extra careful and the manufacturers can update the software. Better still they and the regulators now have an easy way to check their programmers haven’t made the same mistake in future devices. In future, whether vigilant or not, a nurse won’t be able to get it wrong.
Ariane 5 on the launch pad. Photo Credit: (NASA/Chris Gunn) Public Domain via Wikimedia Commons.
If you spent billions of dollars on a gadget you’d probably like it to last more than a minute before it blows up. That’s what happened to a European Space Agency rocket. How do you make sure the worst doesn’t happen to you? How do you make machines reliable?
A powerful way to improve reliability is to use redundancy: double things up. A plane with four engines can keep flying if one fails. Worried about a flat tyre? You carry a spare in the boot. These situations are about making physical parts reliable. Most machines are a combination of hardware and software though. What about software redundancy?
You can have spare copies of software too. Rather than a single version of a program you can have several copies running on different machines. If one program goes wrong another can take over. It would be nice if it was that simple, but software is different to hardware. Two identical programs will fail in the same way at the same time: they are both following the same instructions so if one goes wrong the other will too. That was vividly shown by the maiden flight of the Ariane 5 rocket. Less than 40 seconds from launch things went wrong. The problem was to do with a big number that needed 64 bits of storage space to hold it. The program’s instructions moved it to a storage place with only 16 bits. With not enough space, the number was mangled to fit. That led to calculations by its guidance system going wrong. The rocket veered off course and exploded. The program was duplicated, but both versions were the same so both agreed on the same wrong answers. Seven billion dollars went up in smoke.
Can you get round this? One solution is to get different teams to write programs to do the same thing. The separate teams may make mistakes but surely they won’t all get the same thing wrong! Run them on different machines and let them vote on what to do. Then as long as more than half agree on the right answer the system as a whole will do the right thing. That’s the theory anyway. Unfortunately in practice it doesn’t always work. Nancy Leveson, an expert in software safety from MIT, ran an experiment where different programmers were given programs to write. She found they wrote code that gave the same wrong answers. Even if it had used independently written redundant code it’s still possible Ariane 5 would have exploded.
Redundancy is a big help but it can’t guarantee software works correctly. When designing systems to be highly reliable you have to assume things will still go wrong. You must still have ways to check for problems and to deal with them so that a mistake (whether by human or machine) won’t turn into a disaster.
Navajo Code Talkers, Image from National Archives at College Park, Public domain, via Wikimedia Commons
Bletchley Park, the British code cracking centre helped win World War II, but it is not just breaking codes and ciphers that wins wars, creating unbreakable ones to keep your own secrets safe matters too. Bletchley Park wasn’t the first or only time a secret cryptography team helped win battles or even wars. In World War I secret messages had been successfully sent using Choctaw, the language of a tribe of Native Americans, including to help organise a surprise attack. It worked with their messages left un-cracked. This led to an even more successful code-creating team in World War II based on Navajo. The Navajo “Code Talkers” as they were called, could encode, transmit and decode messages in minutes when it would take hours using conventional codes and ciphers.
In World War II, the US forces used a range of Native American languages to communicate, but a code based on a native Indian language, Navajo, was especially successful. The use of a Navajo-based code was the idea of Philip Johnston after the attack on Pearl Harbour. His parents were missionaries so he had grown up on a Navajo reservation, speaking the language fluently despite how difficult it was. Aged only 9, he acted as an interpreter for a group who went to Washington to try to improve Indian rights.
He suggested using Navajo as a secret language and enlisted in the marines to help bring the idea to fruition. He thought it would work as a secret code because there was no written version of Navajo. It was a purely a spoken language. That meant he was one of very few people who were not Navajo who could speak it. It was also a complex language unlike any other language. The US marines agreed to trial the idea.
To prove it would work, Johnston had Navajo transmit messages in the way they would need to on the battlefield. They could do it close to 100 times faster than it would take using standard cipher machines. That clinched it.
Many Navajo had enlisted after Pearl Harbour and a platoon soley of Navajo were recruited to the project, including a 15 year old, William Dean Yazzie. However, they didn’t just speak in Navajo to transmit messages. The original 29 Navajo recruited worked out the details of the code they would use. Once deployed to the Pacific a group of them also met to further improve the code. None of it was written down apart from in training manuals that did not leave the training site, so there was no chance the code book could be captured in battle. All those involved memorised it and practiced sending messages quickly and accurately. Messages were also always spoken, eg over radio and never written down, making it harder for the code to be cracked based on analysing intercepted messages.
Commonly needed words, like ‘difficult’ or ‘final’ had direct Navajo code words (NA-NE-KLAH and TAH-AH-KWO-DIH). However for critical words (countries, kinds of planes, kinds of ships, etc) they first swapped English words for other English words using one code. They then translated those words into Navajo. That meant even a Navajo speaker outside their trained group wouldn’t immediately understand a message. The code, for example, used birds names in place of kinds of planes. So the English code word for a bomber plane was Buzzard. But then the Navajo for Buzzard was actually used: (JAY-SHO).
Another part of the code was to use Navajo words for letters of the alphabet, so A is for ant translated to WOL-LA-CHE in Navajo. However, to make this more secure two other words stood for A too (apple: BE-LA-SANA and axe: TSE-NILL). Each letter had three alternatives like this and any of the three could be used.
Finally the way that it was used meant a message would always just be a series of unconnected words making no sense even to a Navajo speaker.
The code talkers played a key part in many battles including the iconic battle of Iwo Jima, capturing the heavily defended Japanese controlled island of that name. The US Major responsible for communications said of the battle, “Were it not for the Navajos, the Marines would never have taken Iwo Jima.”
Not only did it make communications much faster than they would have been, unlike other US codes and ciphers, the code talker’s code was never cracked … all thanks to the Navajo team who devised it.
The World Health Organisation currently estimates that around 1.3 billion people, or one in six people on Earth, “experience significant disability”. Designers who are creating devices and tools for people to use need to make sure that the products they develop can be used by as many people as possible, not just non-disabled people, to make sure that everyone can benefit from them.
Disabled people can face lots of barriers in the workplace including some that seem simple to address – problems using everyday ICT and other tech. While there are a lot of fantastic Assistive Technology (AT) products unfortunately not all are suitable and so are abandoned by disabled people as they don’t serve their needs.
One challenge is that some of the people who have been doing the designing might not have direct experience of disability themselves, so they are less able to think about their design from that perspective. Solutions to this can include making sure that disabled computer scientists and human-computer interaction researchers are part of the team of designers and creators in the first place, or by making it easier for other disabled people to be involved at an early stage of design. This means that their experience and ideas can contribute to making the end product more relevant and useful for them and others. Alongside this there is education and advocacy – helping more young computer scientists, technologists and human-computer interaction designers to start thinking early about how their future products can be more inclusive.
An EPSRC project “Inclusive Public Activities for information and Communication Technologies” has been looking at some practical ways to help. Run by Prof. Cathy Holloway and Dr. Maryam Bandukda and their wider team at UCL they have established a panel of disabled academics and professionals who can be ‘critical friends’ to researchers planning new projects. By co-creating a set of guidelines for researchers they are providing a useful resource but it also means that disabled voices are heard at an early stage of the design process so that projects start off in the right direction.
Prof. Holloway and Dr. Bandukda are based at the Global Disability Innovation Hub (GDI Hub) in the department of computer science at UCL. GDI Hub is a global leader in disability innovation and inclusion and has research reaching over 30 million people in 60 countries. The GDI Hub also educates people to increase awareness of disability, reduce stigma and lay the groundwork for more disability-aware designers to benefit people in the future with better products.
An activity that the UCL team ran in February 2024, for schools in East London, was a week-long inclusive ICT “Digital Skills and Technology Innovation” bootcamp. They invited students in Year 9 and above to learn about 3D printing, 3D modelling, laser cutting, AI and machine learning using Python, artificial reality and virtual reality experiences along with a chance to visit Google’s Accessible Discovery Centre and use their skills to “tackle real-world challenges”.
What are some examples of Assistive Technology?
Screen-reading software can help blind or visually impaired people by reading aloud the words on the page. This is something that can help sighted people too, your document can read itself to you while you do something else. The entire world of audio books exists for this reason! D/deaf people can take part more easily in Zoom conversations if text-to-caption software is available so they can read what’s being said. That can also help those whose hearing is fine but who speak a different language and might miss some words. Similarly you can dictate your clever ideas to your computer and device which will type it for you. This can be helpful for someone with limited use of their hands, or just someone who’d rather talk than type – this might also explain the popularity of devices and tools like Alexa or Siri.
Web designers want to (and may need to*) make their websites accessible to all their visitors. You can help too – a simple thing that you can do is to add ALT Text (alternative text) to images. If you ever share an image or gif to social media it’s really helpful to describe what’s in the image for screen readers so that people who can’t view it can still understand what you meant.
*Thanks to regulations that were adopted in 2018 the designers of public sector websites (e.g. government and local council websites where people pay their council tax or apply for benefits) must make sure that their pages meet certain accessibility standards because “people may not have a choice when using a public sector website or mobile app, so it’s important they work for everyone. The people who need them the most are often the people who find them hardest to use”.
“DIX puts disability front and center in the design process, and in so doing aims to create accessible, creative new HCI solutions that will be better for everyone“
You might have come across UI (User Interface(s)) and UX (User Experience), DIX is Disability Interaction – how disabled people use various tech.
Careers
Examples of computer science and disability-related jobs
Both of the jobs listed below are CLOSED and are just for your information only.
[CLOSED] Islington Council, Digital Accessibility Apprentice (f/t), £24k, clos 7 July
Are you interested in web design and do you want to help empower disabled people to become fully engaged within the community? This is a great opportunity to learn about the rapidly growing digital accessibility industry. Qualified and experienced digital accessibility specialists are sought after.
This role is focused on maximising comms-based engagement across the GDI Hub’s portfolio, supporting GDI Hub’s growing outreach across project-based deliverables and organisational comms channels (e.g. social media, websites, content generation).
We’re occasionally asked by school pupils, their parents and teachers about where young people can find out about work experience in something to do with computer science. We’ve put together some general information which we hope is helpful, and there’s also information further down the page that might be useful for people who’ve finished a computing degree and are wondering “What’s next?”.
Work experience for school students
(This section was originally published on our website for teachers – Teaching London Computing).
Supermarkets – not in the store but in the office, learning about inventory software used to manage stock for in-store shopping as well as online shopping (e.g. Ocado etc).
Shops – more generally pretty much every shop has an online presence and may want to display items for sale (perhaps also using software to handle payment).
Websites – someone who’s a blacksmith might not use a computer in their work directly, but the chances are they’d want to advertise their metal-flattening skills to a wider audience which is only really possible with a web presence.
Websites involve technical aspects (not necessarily Python types of things but certainly HTML and CSS / JavaScript) but also making websites accessible for users with visual impairments, e.g. labelling elements helpfully and remembering to add ALT TEXT for users of screenreaders. Technical skills are important but thinking about the end-user is super-important too, and often a skill that people pick up ‘on the job’ rather than being trained about (though that is changing).
Usability – making websites or physical products (e.g. home appliances, cameras, phones, printers, microwaves) easier to use by finding out how easily users can interact with them and considering options for improvement. For computing systems this involves HCI (human-computer interaction) and UX (user experience – e.g. how frustrating is a website?).
Transport – here in London we have buses with a GPS transponder that emits a signal which is picked up by sensors, co-ordinated and translated into real-time information about the whereabouts of various buses on the system. Third-party apps can also use some of this data to provide a service for people who want to know the quickest route to a particular place.
Council services – it’s possible to pay parking fines, council tax and other things online, also utility company bills. The programs involved here need to keep people’s private data secure as well.
Banks – are heavy users of ‘fintech’ (financial technology) and security systems, though that might preclude them taking on people in a work experience setting. Similarly GP surgeries have dedicated IT systems (such as EMIS) for handling confidential patient information and appointments. Even if they can’t take on tech work experience students they may have other work experience opportunities.
Places that offer (or have previously offered) work experience
TechDevJobs website Our ‘jobs in computing’ resource (homepage) should give you an idea of the different sectors which employ all sorts of computer scientists to do all sorts of different things (see the list of jobs organised by sector). There are about 70 80 jobs there so far; it doesn’t cover everything though (that’s almost an impossible task!).
There are obvious computing-related jobs such as a software company looking for a software developer but there’s also a job for a lawyer-researcher (someone who is able to practise as a lawyer if necessary but is going to be doing research) into Cloud Computing. For example there are all sorts of regulatory aspects to computing, some currently under consideration by the UK Government on data leaks, privacy, appropriateness of use and how securely information is stored, and what penalties there are for misuse.
Possibly a local law firm is doing some work in this area and might be open to offering work experience.
Other resources for recent graduates
The TechDev Jobs website (listed above in Other resources) is a great place to start. The jobs ‘advertised’ are usually closed but the collection lists several organisations that are currently employing people in the field of computer science (in the widest sense) and we are adding more all the time. Finding out about jobs is also about finding out about different sectors, some of which you might not have heard of yet – but they are all potential sources of jobs for people with computing skills.
Recent graduates or soon-to-graduate students may be able to help newer students get to grips with things in the Year 1 modules. Sometimes it’s not the computer science and programming that they or the lecturers need assistance with but really practical stuff like logging on and finding the relevant resources.
The Find A Job website from DWP (https://findajob.dwp.gov.uk/search) can be filtered by location and keyword too. Put in a keyword and see what pops up, then filter by salary etc.
Further study: if you’re interested in continuing your studies you might consider a Masters degree (MSc) in computer science and see the panel below for information on studying for a PhD, for which you are usually paid.
The Entry Level Games site isn’t a jobs board but if you’re interested in games design then it gives you a really helpful overview of some of the typical roles, what’s needed to do those roles and information from people who’ve done those jobs.
If you are interested in creating assistive technology or making computing more inclusive you might be interested in the work of the Global Disability Innovation Hub.
Networking is also a good idea to build up contacts and hear about different roles, some people find LinkedIn useful as an online version of networking and as a great place to hear about newly-opened vacancies. You can also take part in local hackathons, or volunteer at code clubs etc. This sort of thing is useful for your CV too.
There are probably organisations near you and it’s fairly likely that they’ll be using computers in one way or another, and you might be useful to them. Open up Google Maps and navigate to where you’re living, then zoom in and see what organisations are nearby. Make a note of them and if they have a vacancies page save that link in a document so that you can visit it every so often and see if a relevant new job has been added. Or contact them speculatively with your CV.
If you have a Gmail account you can set up Google Alerts. Whenever a new web page (e.g. a new job vacancy is published) that satisfies your search criteria you’ll get a daily email with a summary of what’s been added and the link to find out more. This is a way of bringing the job adverts to you!
Digitally stitching together 2D photographs to visualise the 3D world
Composite image of one green glass bottle made from three photographs. Image by Jo Brodie
Imagine you’re the costume designer for a major new film about a historical event that happened 400 years ago. You’d need to dress the actors so that they look like they’ve come from that time (no digital watches!) and might want to take inspiration from some historical clothing that’s being preserved in a museum. If you live near the museum, and can get permission to see (or even handle) the material that makes it a bit easier but perhaps the ideal item is in another country or too fragile for handling.
This is where 3D imaging can help. Photographs are nice but don’t let you get a sense of what an object is like when viewed from different angles, and they don’t really give a sense of texture. Video can be helpful, but you don’t get to control the view. One way around that is to take lots of photographs, from different angles, then ‘stitch’ them together to form a three dimensional (3D) image that can be moved around on a computer screen – an example of this is photogrammetry.
In the (2D) example above I’ve manually combined three overlapping close-up photos of a green glass bottle, to show what the full size bottle actually looks like. Photogrammetry is a more advanced version (but does more or less the same thing) which uses computer software to line up the points that overlap and can produce a more faithful 3D representation of the object.
In the media below you can see a looping gif of the glass bottle being rotated first in one direction and then the other. This video is the result of a 3D ‘scan’ made from only 29 photographs using the free software app Polycam. With more photographs you could end up with a more impressive result. You can interact with the original scan here – you can zoom in and turn the bottle to view it from any angle you choose.
A looping gif of the 3D Polycam file being rotated one way then the other. Image by Jo Brodie
You might walk around your object and take many tens of images from slightly different viewpoints with your camera. Once your photogrammetry software has lined the images up on a computer you can share the result and then someone else would be able to walk around the same object – but virtually!
Photogrammetry is being used by hobbyists (it’s fun!) but is also being used in lots of different ways by researchers. One example is the field of ‘restoration ecology’ in particular monitoring damage to coral reefs over time, but also monitoring to see if particular reef recovery strategies are successful. Reef researchers can use several cameras at once to take lots of overlapping photographs from which they can then create three dimensional maps of the area. A new project recently funded by NERC* called “Photogrammetry as a tool to improve reef restoration” will investigate the technique further.
Photogrammetry is also being used to preserve our understanding of delicate historic items such as Stuart embroideries at The Holburne Museum in Bath. These beautiful craft pieces were made in the 1600s using another type of 3D technique. ‘Stumpwork’ or ‘raised embroidery’ used threads and other materials to create pieces with a layered three dimensional effect. Here’s an example of someone playing a lute to a peacock and a deer.
“Satin worked with silk, chenille threads, purl, shells, wood, beads, mica, bird feathers, bone or coral; detached buttonhole variations, long-and-short, satin, couching, and knot stitches; wood frame, mirror glass, plush”, 1600s. Photo CC0 from Metropolitan Museum of Art uploaded by Pharos on Wikimedia.
Using photogrammetry (and other 3D techniques) means that many more people can enjoy, interact with and learn about all sorts of things, without having to travel or damage delicate fabrics, or corals.
*NERC (Natural Environment Research Council) and AHRC (Arts and Humanities Research Council) are two organisations that fund academic research in universities. They are part of UKRI (UK Research & Innovation), the wider umbrella group that includes several research funding bodies.
Other uses of photogrammetry
Examples of cultural heritage and ecology are highlighted in the post but also interactive games (particularly virtual reality), engineering and crime scene forensics and the film industry use photogrammetry, an example is Mad Max: Fury Road which used the technique to create a number of its visual effects. Hobbyists also create 3D versions (called ‘3D assets’) of all sorts of objects and sell these to games designers to include in their games for players to interact with.
What is photogrammetry? (12 November 2021) Great Barrier Reef Foundation “What it is, why we’re using it and how it’s helping uncover the secrets of reef recovery and restoration.” [EXTERNAL]
Even if you’re the best keyboard player in the world the sound you can get from any one key is pretty much limited to ‘loud’ or ‘soft’, ‘short’ or ‘long’ depending on how hard and how quickly you press it. The note’s sound can’t be changed once the key is pressed. At best, on a piano, you can make it last longer using the sustain pedal. A violinist, on the other hand, can move their finger on the string while it’s still being played, changing its pitch to give a nice vibrato effect. Wouldn’t it be fun if keyboard players could do similar things.
Andrew McPherson and other digital music researchers at QMUL and Drexel University came up with a way to give keyboard performers more room to express themselves like this. TouchKeys is a thin plastic coating, overlaid on each key of a keyboard, but barely noticeable to the keyboard player. The coating contains sensors and electronics that can change the sound when a key is touched. The TouchKeys’ electronics connect to the keyboard’s own controller and so changes the sounds already being made, expanding the keyboard’s range. This opens up a whole world of new sonic possibilities to a performer.
The sensors can follow the position and movement of your fingers and respond appropriately in real-time, extending the range of sounds you can get from your keyboard. By wiggling your finger from side-to-side on a key you can make a vibrato effect, or you change the note’s pitch completely by sliding your finger up and down the key. The technology is similar to a phone’s touchscreen where different movements (‘gestures’) make different things happen. An advantage of the system is that it can easily be applied to a keyboard a musician already knows how to play, so they’ll find it easy to start to use without having to make big changes to their style of playing.
They wanted to get TouchKeys out of the lab and into the hands of more musicians, so teamed up with members of London’s Music Hackspace community, who run courses in electronic music, to create some initial versions for sale. Early adopters were able to choose either a DIY kit to add to their own keyboard, wire up and start to play, or choose a ready-to-play keyboard with the TouchKeys system already installed.
The result is that lots of musicians are already using TouchKeys to get more from their keyboard in exciting new ways.
Jo Brodie and Paul Curzon, Queen Mary University of London
Earlier this year Professor Andrew McPherson gave his inaugural lecture (a public lecture given by an academic who has been promoted) at Imperial College London where he is continuing his research. Watch his lecture.
Video games were once considered to be only of interest to boys, and the early games industry was dominated by men. Despite that, a teenage girl, Joyce Weisbecker, was one of the pioneers of commercial game development.
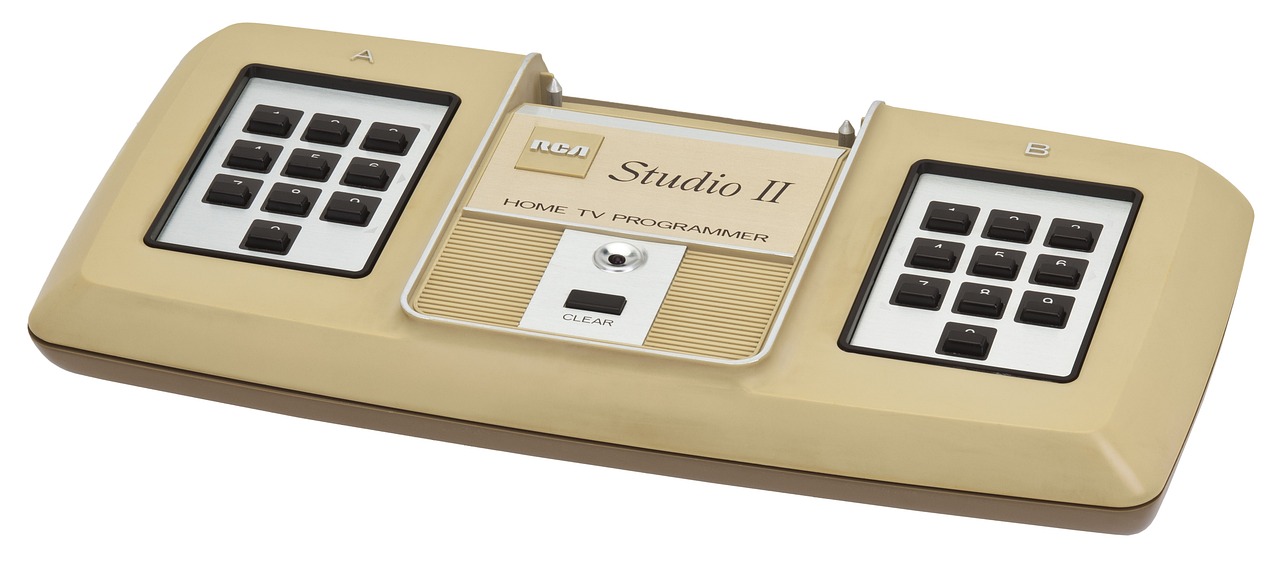
Originally, video games were seen as toys for boys. Gradually it was realised that there was a market for female game players too, if only suitably interesting games were developed, so the games companies eventually started to tailor games for them. That also meant, very late in the day, they started to employ women as games programmers. Now it is a totally normal thing to do. However, women were also there from the start, designing games. The first female commercial programmer (and possibly first independent developer) was Joyce Weisbecker. Working as an independent contractor she wrote her first games for sale in 1976 for the RCA Studio II games console that was released in January 1977.
Joyce was only a teenager when she started to learn to program computers and wrote her first games. She learnt on a computer that her engineer father designed and built at home called FRED (Flexible Recreational and Educational Device). He worked for RCA (originally the Radio Corporation of America), one of the major electronics, radio, TV and record companies of the 20th century. The company diversified their business into computers and Joyce’s father designed them for RCA (as well as at home for a hobby). He also invented a programming language called CHIP-8 that was used to program the RCA computers. This all meant Joyce was in a position to learn CHIP-8 and then to write programs for RCA computers including their new RCA Studio II games console before the machine was released, as a post-high school summer job.
The code for two games that she wrote in 1976, called Snake Race and Jackpot, were included in the manual for an RCA microcomputer called the COSMAC VIP, and she also wrote more programs for it the following year. These computers came in kit form for the buyer to build themselves. Her programs were example programs included for the owner to type in and then play once they had built the machine. Including them meant their new computer could do something immediately.
She also wrote the first game that she was paid for in that Summer of 1976. It was for the RCA Studio II games console, and it earned her $250 – well over $1000 in today’s money, so worth having for a teenager who would soon be going on to college. It was a quiz program, called TV School House I. It pitted two people against each other, answering questions on topics such as maths, history and geography, with two levels of difficulty. Questions were read from question booklets and whoever typed in the multiple choice answer number the fastest got the points for a question, with more points the faster they were. There is currently a craze for apps that augment physical games and this was a very early version of the genre.
Speedway screen from Wikimedia
She quickly followed it with racing and chase games, Speedway and Tag, though as screens were still very limited then, with only tiny screens, the graphics of all these games were very, very simple – eg racing rectangles around a blocky, rectangular racing track.
Unfortunately, the RCA games console itself was a commercial failure as it couldn’t compete with consoles like the Atari 2600, so RCA soon ended production. Joyce, meanwhile, retired from the games industry, still a teenager, ultimately becoming a radar signal processing engineer.
While games like Pong had come much earlier, the Atari 2600, which is credited with launching the first video game boom, was released in 1977, with Space Invaders, one of the most influential video games of all time, released in 1980. Joyce really was at the forefront of commercial games design. As a result her papers related to games programming, including letters and program listings, are now archived in the Strong National Museum of Play in New York.


.jpg)


