CS4FN Advent – Day 16: candy cane or walking aid: designing for everyone, human computer interaction

Welcome to Day 16 of the CS4FN Christmas Computing Advent Calendar in which we’re posting a blog post every day in December until (and including) Christmas Day.

We’re celebrating the breadth of computing research and also the history of CS4FN, a project which has been distributing free magazines to subscribing UK schools since 2005 (ask your teacher to subscribe for next year’s magazine).

Today’s advent calendar picture is of a candy cane which made me think both of walking aids and of support sticks that alert others that the person using it is blind or visually impaired.

A white candy cane with green and red stripes.

We’ve worked with several people over the years to write about their research into making life easier for people with a variety of disabilities. Issue 19 of our magazine (“Touch it, feel it, hear it!”) focused on the DePiC project (‘Design Patterns for Inclusive Collaboration’) which included work on helping visually impaired sound engineers to use recording studio equipment, and you can read one of the articles (see ‘2. The Haptic Wave’) from that magazine below.
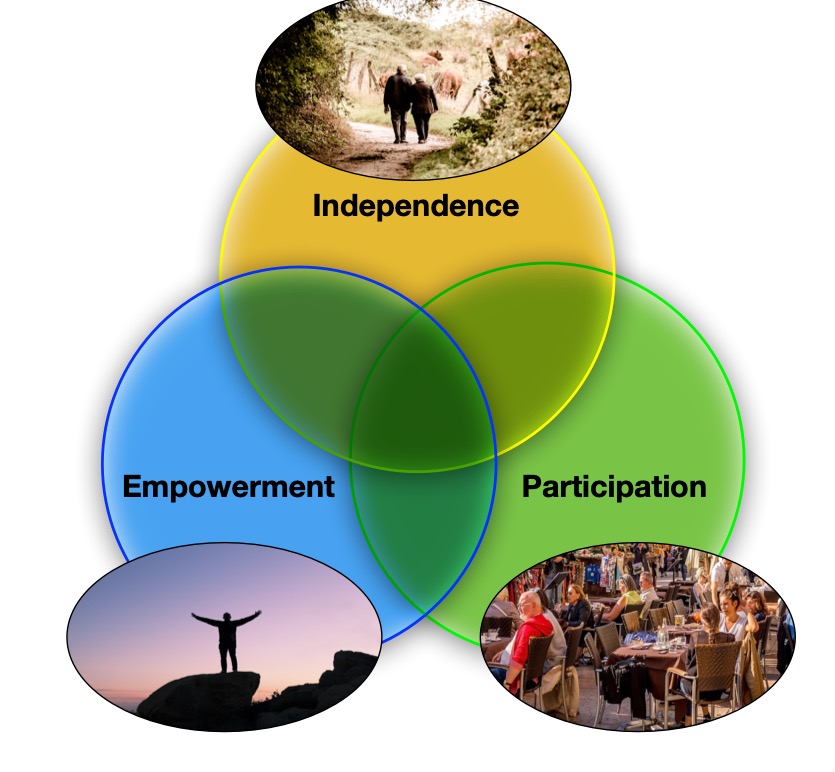
Our most recent CS4FN magazine (issue 27, called “Smart Health: decisions, decisions, decisions“) was about Bayesian mathematics and its use in computing, but one of those uses might be an app with the potential to help people with arthritis get medical support when they most need it (rather than having to wait until their next appointment) – download the magazine by clicking on its title and scroll to page 16 & 17 (p9 of the 11 page PDF). Our writing also supports the (obvious) case, that disabled people must be involved at the design and decision-making stages.


1. Design for All (and by All!)

by Paul Curzon, QMUL. This article was originally published on the CS4FN website.

Making things work for everyone

Designing for the disabled – that must be a niche market mustn’t it? Actually no. One in five people have a disability of some kind! More surprising still, the disabled have been the inspiration behind some of the biggest companies in the world. Some of the ideas out there might eventually give us all super powers.

Just because people have disabilities doesn’t mean they can’t be the designers, the innovators themselves of course. Some of the most innovative people out there were once labelled ‘disabled’. Just because you are different doesn’t mean you aren’t able!

Where do innovators get their ideas from? Often they come from people driven to support people currently disadvantaged in society. The resulting technologies then not only help those with disabilities but become the everyday objects we all rely on. A classic example is the idea of reducing the kerbs on pavements to make it possible for people in wheelchairs to get around. Turns out of course that they also help people with pushchairs, bikes, roller-blades and more. That’s not just a one-off example, some of the most famous inventors and biggest companies in the world have their roots in ‘design for all’.

Designing for more extreme situations pushes designers into thinking creatively, thinking out of the box. That’s when totally new solutions turn up. Designing for everyone is just a good idea!

2. Blind driver filches funky feely sound machine! The Haptic Wave

by Jane Waite, QMUL. This article was originally published on the CS4FN website.

The blind musician Joey Stuckey in his recent music video commandeers then drives off in a car, and yes he is blind. How can a blind person drive a car, and what has that got to do with him trying to filch a sound machine? So maybe taking the car was just a stunt, but he really did try and run off with a novel sound machine!

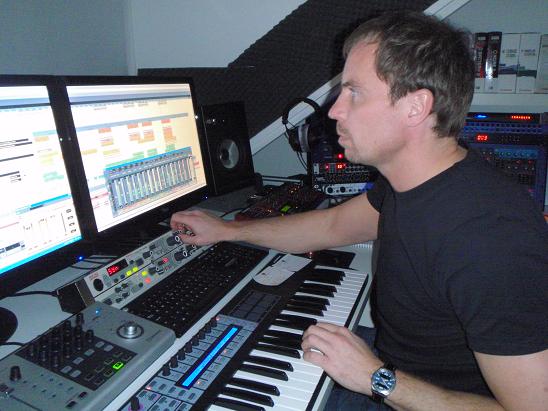
As well as fronting his band Joey is an audio engineer. Unlike driving a car, which is all about seeing things around you – signs, cars pedestrians – being an audio engineer seems a natural job for someone who is blind. Its about recording, mixing and editing music, speech and sound effects. What matters most is that the person has a good ear. Having the right skills could easily lead to a job in the music industry, in TV and films, or even in the games industry. It’s also an important job. Getting the sound right is critical to the experience of a film or game. You don’t want to be struggling to hear mumbling actors, or the sound effects to drown out a key piece of information in a game.

Peter Francken in his studio. Image from Wikimedia Commons.

Mixing desks

Once upon a time Audio engineers used massive physical mixing desks. That was largely ok for a blind person as they could remember the positions of the controls as well as feel the buttons. As the digital age has marched on, mixing desks have been replaced by Digital Audio Workstations. They are computer programs and the trouble is that despite being about sound, they are based on vision.

When we learn about sound we are shown pictures of wavy lines: sound waves. Later, we might use an oscilloscope or music editing software, and see how, if we make a louder sound, the curves get taller on the screen: the amplitude. We get to hear the sound and see the sound wave at the same time. That’s this multimodal idea again, two ways of sensing the same thing.

But hang on, sound isn’t really a load of wavy lines curling out of our mouths, and shooting away from guitar strings. Sound is energy and atoms pushing up against each other. But we think of sound as a sound wave to help us understand it. That’s what a computer scientist calls abstraction: representing things in a simpler way. Sound waves are an abstraction, a simplified representation, of sound itself.

Sound waveform image by Gordon Johnson from Pixabay

The representation of sound as sound waves, as a waveform, helps us work with sound, and with Digital Audio Workstations it is now essential for audio engineers. The engineer works with lines, colors, blinks and particularly sound waves on a screen as they listen to the sound. They can see the peaks and troughs of the waves, helping them find the quiet, loud and distinctive moments of a piece of music, at a glance, for example. That’s great as it makes the job much easier…but only if you are fully sighted. It makes things impossible for someone with a visual impairment. You can’t see the sound waves on the editing screen. Touching a screen tells you nothing. Even though it’s ultimately about sounds, doing your job has been made as hard as driving a car. This is rather sad given computers have the potential to make many kinds of work much more accessible to all.

Feel the sound

The DePIC research team, a group of people from Goldsmiths, Queen Mary University of London and Bath Universities with a mission to solve problems that involve the senses, decided to fix it. They’ve created the first ever plug-in software for professional Digital Audio Workstations that makes peak level meters completely accessible. It uses ‘sonification’: it turns those visual signals in to sound! decided to fix the problems. They brought together Computer Scientists, Design experts, and Cognitive Scientists and most importantly of all audio engineers who have visual impairments. Working together over two years in workshops sharing their experiences and ideas, developing, testing and improving prototypes to figure out how a visually impaired engineer might ‘see’ soundwaves. They created the HapticWave, a device that enables a user to feel rather than see a sound wave.

The HapticWave

The HapticWave combines novel hardware and software to provide a new interface to the traditional Digital Audio Workstation. The hardware includes a long wooden box with a plastic slider. As you move the slider right and left you move forward and backwards through the music. On the slider there is a small brass button, called a fader. Tiny embossed stripes on the side of the slider let you know where the fader is relative to the middle and ends of the slider. It moves up and down in sync with the height of the sound wave. So in a quiet moment the fader returns to the centre of the slider. When the music is loud, the fader zooms to the top of the handle. As you slide forwards and backwards through the music the little button shoots up and down, up and down tracing the waveform. You feel its volume changing. Music with heavy banging beats has your brass button zooming up and down, so mind your fingers!

So back to the title of the article! Joey trialled the HapticWave at a research workshop and rather wanted to take one home, he loved it so much he jokingly tried distracting the researchers to get one. But he didn’t get away with it – maybe his getaway car just wasn’t fast enough!

3. An audio illusion, and an audiovisual one

This one-minute video illustrates an interesting audio illusion, demonstrating that our brains are ‘always using prior information to make sense of new information coming in’.

The McGurk Effect

You can read more about the McGurk effect on page 7 of issue 5 of the CS4FN magazine, called ‘The Perception Deception‘.


4. Previous Advent Calendar posts

CS4FN Advent – Day 1 – Woolly jumpers, knitting and coding (1 December 2021)


CS4FN Advent – Day 2 – Pairs: mittens, gloves, pair programming, magic tricks (2 December 2021)


CS4FN Advent – Day 3 – woolly hat: warming versus cooling (3 December 2021)


CS4FN Advent – Day 4 – Ice skate: detecting neutrinos at the South Pole, figure-skating motion capture, Frozen and a puzzle (4 December 2021)


CS4FN Advent – Day 5 – snowman: analog hydraulic computers (aka water computers), digital compression, and a puzzle (5 December 2021)


CS4FN Advent – Day 6 – patterned bauble: tracing patterns in computing – printed circuit boards, spotting links and a puzzle for tourists (6 December 2021)


CS4FN Advent – Day 7 – Computing for the birds: dawn chorus, birds as data carriers and a Google April Fool (plus a puzzle!) (7 December 2021)


CS4FN Advent – Day 8: gifts, and wrapping – Tim Berners-Lee, black boxes and another computing puzzle (8 December 2021)


CS4FN Advent – Day 9: gingerbread man – computing and ‘food’ (cookies, spam!), and a puzzle (9 December 2021)


CS4FN Advent – Day 10: Holly, Ivy and Alexa – chatbots and the useful skill of file management. Plus win at noughts and crosses – (10 December 2021)


CS4FN Advent – Day 11: the proof of the pudding… mathematical proof (11 December 2021)


CS4FN Advent – Day 12: Computer Memory – Molecules and Memristors – (12 December 2021)


CS4FN Advent – Day 13: snowflakes – six-sided symmetry, hexahexaflexagons and finite state machines in computing (13 December 2021)


CS4FN Advent – Day 14 – Why is your internet so slow + a festive kriss-kross puzzle (14 December 2021)


CS4FN Advent – Day 15 – a candle: optical fibre, optical illusions (15 December 2021)


CS4FN Advent – Day 16: candy cane or walking aid: designing for everyone, human computer interaction – this post


Back (page) to health

Improvements in technology and decision making are transforming the way we look after our health. Here are some more interesting ideas to keep people alive and well.

Woman wearing VR headset looking at the sky.
Image by Pexels from Pixabay

The future is in your poo

You’ve heard of telling a person’s future from reading their tea leaves. Scientists believe an effective way of seeing a town’s future may be in the poo. By looking for infection in the waste at sewerage works it’s possible to get fast and accurate local knowledge of where infection rates are high and where low to feed into decision making tools.

Health advice: Stay in the toilet, Stay safe. Help the NHS.

Virtually breaking quarantine

The game, World of Warcraft, a multi-user dungeon game, helped virologists understand how people might behave in pandemics. The game’s developers released a plague that could be passed between avatars. The game’s contaminated area was quarantined. Rather than dying out, the virus escaped – because people broke into the quarantined areas to gawk, then left taking the virus with them.

Health advice: Your avatar should obey quarantine rules too!

The missing bullet holes

To stay healthy in a war, avoid being hit by a bullet. In World War II, many aircraft returned badly damaged. Abraham Wald studied them to decide where better armour was needed. There were more bullet holes in the fuselage than the engines. Where would you add the armour? Abraham added it where there were no bullet holes. He reasoned that the lack of holes in places like engines on returning planes meant that being hit there brought the plane down. Being hit elsewhere did not kill the pilots as those planes made it home!

Health advice: Dodge bullets by making good decisions …

Cybersick of virtual reality

The AI can detect puke-inducing movement and automatically correct the image.

A problem with virtual reality is that wearing a headset can be so immersive that it makes some people actually sick. This happens if you move about when watching a 3D video that was shot from a single place. Artificial intelligence software has come to the rescue, detecting puke-inducing movement and automatically correcting the image.

Health advice: If no bucket, always keep an AI handy.

Shining light on cancers

Cancer treatments like chemotherapy and radiotherapy make patients ill. Some drugs make cancer sensitive to light, allowing tumours to be killed by painlessly shining light on them instead. Sadly, that’s not easy when cancers are inside the body. A new Japanese solution is an LED chip, based on the technology used by contactless payment cards to provide power from a distance. Surgeons place it under the skin and leave it there. They glue it in place using a sticky protein from the feet of mussels. It shines low-intensity green light on the cancer, shrinking it.

Health advice: Stick a chip to your tumour

Smart sometimes means no gadgets

Being smart about health doesn’t have to be high-tech or even involve drugs. Exercise, for example, can be as effective helping with depression as taking medicine. Being out in nature can help too, so sometimes it’s worth leaving the gadgets behind and just going for a walk to enjoy the beauty of nature.

Health advice: Walk weekly in the woods

Paul Curzon, Queen Mary University of London, Spring 2021

Download Issue 27 of the cs4fn magazine on Smart Health here.

This post and issue 27 of the cs4fn magazine have been funded by EPSRC as part of the PAMBAYESIAN project.

Gadgets based on works of fiction

Why might a computer scientist need to write fiction? To make sure she creates an app that people actually need.

Portrait images of lots of people used as personas.

Writing fiction doesn’t sound like the sort of skill a computer scientist might need. However, it’s part of my job at the moment. Working with expert rheumatologists Amy MacBrayne and Fran Humby, I am helping a design team understand what life with rheumatoid arthritis is like, so they can design software that is actually needed and so will be used and useful.

A big problem with developing software is that programmers tend to design things for themselves. However, programmers are not like the users of their software. They have different backgrounds and needs and they have been trained to think differently. Worse, they know the system they are developing inside out, unlike its users. An important first step in a project is to do background research to understand your users. If designing an app for people with rheumatoid arthritis, you need to know a lot about the lives of such people. To design a successful product, you particularly need to understand their unfulfilled goals. What do they want to be able to do that is currently hard or impossible?

What do you do with the research? Alan Cooper’s idea of ‘Personas’ are a powerful next step – and this is where writing fiction comes in. Based on research, you write descriptions of lots of fictional characters (personas), each representing groups of people with similar goals. They have names, photos and realistic lives. You also write scenarios about their lives that help understand their goals. Next, you merge and narrow these personas down, dropping some, creating new ones, altering others. Your aim is to eventually end up with just one, called a primary persona. The idea is that if you design for the primary persona, you will create something that meets the goals of the groups represented by the other personas it replaced.

The primary persona (let’s call her Samira) is then used throughout the design process as the person being designed for. If wondering whether some new feature or way of doing things is a good idea, the designers would ask themselves, “Would Samira actually want this? Would she be able to use it?” If they can think of her as a real person, it is much easier to make decisions than if thinking of some non-existent abstract “user” who becomes whatever each team member wants them to be. It helps stop ‘feature bloat’ where designers add in every great idea for a new feature they have but end up with a product so complex no one can, or wants to, use it.

As part of the Queen Mary PAMBAYESIAN project we have been talking to rheumatoid arthritis patients and their doctors to understand their needs and goals. I’ve then created a cast of detailed personas to represent the results. These can act as an initial set of personas to help future designers designing apps to support those with the disease.

If you thought creative writing wasn’t important to a computer scientist, think again. A good persona needs to be as powerfully written and as believable as a character in a good novel. So, you should practice writing fiction as well as writing programs.

Read some of our personas about living with rheumatoid arthritis here.

– Paul Curzon, Queen Mary University of London, Spring 2021

See the related Teaching London Computing Activity

Find out more about goal-directed design and personas from its creator in Alan Cooper’s wonderful book “The inmates are running the Asylum” (the inmates are computer scientists!)

Download Issue 27 of the cs4fn magazine on Smart Health here.

This post and issue 27 of the cs4fn magazine have been funded by EPSRC as part of the PAMBAYESIAN project.

How do you solve a problem like arthritis?

Some diseases can’t be cured. Doctors and nurses just try to control the disease to stop them ruining people’s lives. Perhaps smartphone apps can pull off the trick of giving patients better care while giving clinicians more time to spend with the patients who most need them? A Venn diagram is at the centre of the Queen Mary team’s prototype.

A Venn diagram of low participation, low empowerment and low independence with images linked to each - people eating in a resterount, a person holding out arms at the top of a peak and two people walking.

What is rheumatoid arthritis?

Normally your immune system does a good job of fighting infection and keeping you healthy. But, if you have an autoimmune disease, it can also attack your healthy cells, causing inflammation and damage. Rheumatoid arthritis is like this: a painful condition that mostly affects hands, knees and feet as the person’s immune system attacks their joints, making them swell painfully. It affects around 400,000 people in the UK and is more common in women than men.

People with the disease alternate between periods when it is under control and they have few symptoms, and with days or weeks of painful ‘flares’ where it is very, very bad. During these flares it especially affects a person’s ability to live a normal life. It can be hard to move around comfortably, do exercise – plus it interferes with their ability to work. It can also leave them totally reliant on family and friends just to do everyday things like dress or eat, never mind go out. This can lead to depression and puts a strain on friendships.

Treating the disease

Treatment, which can include tablets, injections, physiotherapy and sometimes surgery, slows the disease, keeping it under control for long periods. Sufferers are also given advice on lifestyle changes. This all reduces the risk of joint damage and helps people live their life more fully.

At appointments, doctors collect information to help them see how the disease is progressing. A Disease Activity Score (DAS) calculator lets them combine measurements for pain, how tender or swollen their patient’s joints are and how many joints are affected. Regular blood tests keep track of the amount of inflammation and how the body is reacting to drugs. This helps them decide if they need to adjust the medication.

If it is caught early, modern medicine reduces the worst effects of the disease, helped by keeping a close eye on the Disease Activity Score as treatments may need to be repeatedly adjusted to control flares. This requires regular hospital visits which uses up scarce healthcare resources and is very time-consuming for patients. It is hampered because hospital appointments may only happen twice a year due to the number of patients. Everyone wants to give more personalised care, but hospitals just can’t afford to provide it.

Supporting doctors

So, what do you do when there just aren’t enough doctors to see everyone as regularly as needed to maintain their patients’ wellbeing? One solution is to use remote monitoring with an app on a patient’s smartphone, so involving patients more directly in their own care. They can use such apps to regularly record their own disease activity measurements, sharing the information with their doctor to save visiting the hospital.

A smart app

This is an improvement, but the measurements still require expert monitoring and can take more of the doctor’s time. However, if smartphones can actually be made to be, well, smart, then they could help give advice between hospital visits and alert the hospital team, when needed, so they can step in. This might involve, for example, loading the app with background knowledge about rheumatoid arthritis, expert knowledge from lots of doctors, and creating an artificial intelligence to use this information effectively for each patient.

Hospital specialists and computer scientists at Queen Mary are developing such a prototype based on Bayesian networks as the artificial intelligence core. Bayesian networks are based on reasoning about the causes of things and how likely different things are to be the cause of something being observed. Building the prototype involves finding out if patients and clinicians find such tools useful and acceptable (some people might find clinic visits reassuring, while some may be keener to avoid taking the time off work, for example).

Smart and patient centred

This still focusses on a clinician’s view of treatment using drugs though. With a smartphone app we can perhaps do better and take the person’s life into account – but how? The first step is to understand patient goals. Patients would need to be willing to share lots of information about themselves so that the software can learn as much as possible about them. Eventually, this might be done using sensors that automatically detect information: how much pain they are in, how stiff their joints are, how much they move around, how long it takes them to get out of a chair, how much sleep they get, how often they meet others, if and when they take their medicine, and so on. Rather than just focussing on medical treatment it can then focus advice ‘holistically’ on the whole person.

The Queen Mary team’s approach is centred around three different things: helping people with physical independence so they can move around and look after themselves; empowering them to manage their condition and general well-being themselves; and participation in the sense of helping them socialise, keep friendships and maintain family bonds.

The Bayesian network processes the information about patients and computes their predicted levels of independence, empowerment and participation, working out how good or bad things are for them at the moment. This places them in one of seven positions in a Venn diagram of the three dimensions over which areas need most attention. It then gives appropriate advice, aiming to keep all three dimensions in balance, monitoring what happens, but also alerting the hospital when necessary.

So, for example, if the Bayesian network judges independence low, participation high and empowerment low, the patient is in the Venn diagram intersection of low empowerment and low independence. Advice in the following weeks, based on this area of the Venn diagram, would focus on things like coping with pain and stiffness, getting better sleep, as well as how to manage the disease in general.

By personalising advice and focusing on the whole person, it is hoped patients will get more appropriate care as soon as they need it, but doctors’ time will also be freed up to focus on the patients who most need their help.

– Jo Brodie, Hamit Soyel and Paul Curzon, Queen Mary University of London, Spring 2021

Download Issue 27 of the cs4fn magazine on Smart Health here.

This post and issue 27 of the cs4fn magazine have been funded by EPSRC as part of the PAMBAYESIAN project.

Are you there yet?

Plenty of people love the Weasley family’s clock from the Harry Potter books and films. It shows where members of the family are at any given time. Instead of numbers giving the time, the clock face has locations where someone might be (home, school, shopping) and the many hands on the clock show the family members. The wizarding world uses magic to make their whereabouts clock work, but muggles (and squibs) can use mobile network data to build a simple version, and use Bayesian networks to improve it.

A cell phone tower looking up from inside to a blue sky

Your mobile phone is in contact with several cell towers in the mobile provider’s network. When you want to send a message, it goes first to the nearest cell tower before passing through the network, finally reaching your friend’s phone. As you move around, from home to school, for example, you will pass several towers. The closer you are to a tower the stronger the signal there, and the phone network uses this to estimate where you are, based on signal strength from several towers. This means that, as long as your phone is with you, it can act as a sensor for your location and track you, just like the Weasley’s whereabouts clock.

You could also have a similar system at home that monitors your location, so that it switches on the lights and heating as you get closer to home to welcome you back. On a typical day you might head home somewhere between 3 and 6pm (depending on after-school events) and as you leave school the connection to your phone from the tower nearest the school will weaken, but connections will strengthen with the other cell towers on your route home. But what if you appear to be heading home at 11 in the morning? Perhaps you are, or maybe actually the signal has just dropped from the tower nearest to the school so a tower nearer your home is now getting the strongest signal!

A system using Bayesian logic to determine ‘near home’ or ‘not near home’ can be trained to put things into context. Unless you are ill, it’s unlikely that you’d be heading home before the afternoon so you can use these predicted timings to give a likelihood score of an event (such as you heading home). A Bayesian network takes a piece of information (‘person might be nearby’) and considers this in the context of previous knowledge (‘and that’s expected at this time of day so probably true’ or ‘but is unlikely to be nearby now so more information is needed’). Unlike machine learning which just looks for any patterns in data, in a Bayesian networks approach the way one thing being considered does or does not cause other things is built in from the outset. Here it builds in the different possible causes of the signal dropping at a cell tower.

You could also set up a similar system in a home using wifi points to predict where you are and so what you are doing. Information like that could then feed data into a personalised artificial intelligence looking after you. Not all magic has to be run by magic!

-Jo Brodie, Queen Mary University of London, Spring 2021

Download Issue 27 of the cs4fn magazine on Smart Health here.

This post and issue 27 of the cs4fn magazine have been funded by EPSRC as part of the PAMBAYESIAN project. This article was inspired by

Inspired by the blog on Presence Detection Part 1: Home Assistant & Bayesian Probability and a previous cs4fn article on making a Whereabouts Clock.

So, so tired…

Fatigue is a problem that people with a variety of long-term diseases can also suffer from.

A man, hands over face, very, very tired.
Image by Małgorzata Tomczak from Pixabay

This isn’t just normal tiredness, but something much, much worse: so bad that it is a struggle to do anything at all, destroying any chance of a normal life. Doctors can often do little to help beyond managing the underlying disease, then hope the fatigue sorts itself out. Sometimes fatigue can stay with the person long, long after. Maha Albarrak, for her PhD, is exploring how computer technology might help people cope. Her first step is to interview those suffering to find out what kind of help they really need. Then she will work closely with volunteers to come up with solutions that solve the problems that matter.

– Paul Curzon, Queen Mary University of London, Spring 2021

Download Issue 27 of the cs4fn magazine on Smart Health here.

This post and issue 27 of the cs4fn magazine have been funded by EPSRC as part of the PAMBAYESIAN project.

Is your healthcare algorithm racist?

Algorithms are taking over decision making, and this is especially so in healthcare. But could the algorithms be making biased decisions? Could their decisions be racist? Yes, and such algorithms are already being used.

A medical operation showing an anaesthetist and the head of the patient
Image by David Mark from Pixabay

There is now big money to be made from healthcare software. One of the biggest areas is in intelligent algorithms that help healthcare workers make decisions. Some even completely take over the decision making. In the US, software is used widely, for example, to predict who will most benefit from interventions. The more you help a patient the more it costs. Some people may just get better without extra help, but for others it means the difference between a disability that might have been avoided or not, or even life and death. How do you tell? It matters as money is limited, so someone has to choose. You need to be able to predict outcomes with or without potential treatments. That is the kind of thing that machine learning technology is generally good at. By looking at the history of lots and lots of past patients, their treatments and what happened, these artificial intelligence programs can spot the patterns in the data and then make predictions about new patients.

This is what current commercial software does. Ziad Obermeyer, from UC Berkeley, decided to investigate how well the systems made those decisions. Working with a team combining academics and clinicians, they looked specifically at the differences between black and white patients in one widely used system. It made decisions about whether to put patients on more expensive treatment programmes. What they found was that the system had a big racial bias in the decisions it made. For patients that were equally ill, it was much more likely to recommend white patients for treatment programmes.

One of the problems with machine learning approaches is it is hard to see why they make the decisions they do. They just look for patterns in data, and who knows what patterns they find to base their decisions on? The team had access to the data of a vast number of patients the algorithms had made recommendations about, the decisions made about them and the outcomes. This meant they could evaluate whether patients were treated fairly.

The data given to the algorithm specifically excluded race, supposedly to stop it making decisions on colour of skin. However, despite not having that information, that was ultimately what it was doing. How?

The team found that its decision-making was based on predicting healthcare costs rather than how ill people actually were. The greater the cost saving of putting a person on a treatment programme, the more likely it was to recommend them. At first sight, this seems reasonable, given the aim is to make best use of a limited budget. The system was totally fair in allocating treatment based on cost. However, when the team looked at how ill people were, black people had to be much sicker before they would be recommended for help. There are lots of reasons more money might be spent on white people, so skewing the system. For example, they may be more likely to seek treatment earlier or more often. Being poor means it can be harder to seek healthcare due to difficulties getting to hospital, difficulties taking time off work, etc. If more black people in the data used to train the system are poor then this will lead to them seeking help less, so less is being spent on them. The system had spotted patterns like this and that was how it was making decisions. Even though it wasn’t told who was black and white, it had learnt to be biased.

There is an easy way to fix the system. Instead of including data about costs and having it use that as the basis of decision making, you can use direct measures of how ill a person is: for example, using the number of different conditions the patient is suffering from and the rule of thumb that the more complications you have, the more you will benefit from treatment. The researchers showed that if the system was trained this way instead, the racial bias disappeared. Access to healthcare became much fairer.

If we are going to allow machines to take healthcare decisions for us based on their predictions, we have to make sure we know how they make those predictions, and make sure they are fair. You should not lose the chance of the help you need just because of your ethnicity, or because you are poor. We must take care not to build racist algorithms. Just because computers aren’t human doesn’t mean they can’t be humane.

– Paul Curzon, Queen Mary University of London, Spring 2021

Download Issue 27 of the cs4fn magazine on Smart Health here.

This post and issue 27 of the cs4fn magazine have been funded by EPSRC as part of the PAMBAYESIAN project.

Solving real problems with Bayesian networks

Bayesian networks give a foundation for tools that support decision making based on evidence collected and the probabilities of one thing causing another (see “What are the chances of that?“).

COVID virus with DNA strand in background.
Image by Pete Linforth from Pixabay

The first algorithms that enabled Bayesian network models to be calculated on a computer were discovered separately by two different research groups in the late 1980s. Since then, a series of easy-to-use software packages have been developed that implement these algorithms, so that people without any knowledge of computing or statistics can easily build and run their own models.

These algorithms do ‘exact’ computations and can handle Bayesian networks for many different types of problems, but they can run into a barrier: when run on Bayesian networks beyond a certain size or complexity, they take too long to compute even on the world’s fastest computers. However, newer algorithms – which provide good approximate calculations rather than exact ones – have made it possible to deal with much larger problems, and this is a really exciting ongoing research area.

– Norman Fenton, Queen Mary University of London, Spring 2021

Download Issue 27 of the cs4fn magazine on Smart Health here.

This post and issue 27 of the cs4fn magazine have been funded by EPSRC as part of the PAMBAYESIAN project.

Diagnose? Delay delivery? Decisions, decisions. Decisions about diabetes in pregnancy

In the film Minority Report, a team of psychics – who can see into the future – predict who might cause harm, allowing the police to intervene before the harm happens. It is science fiction. But smart technology is able to see into the future. It may be able to warn months in advance when a mother’s body might be about to harm her unborn baby and so allow the harm to be prevented before it even happens.

Baby holding feet with feet in foreground.
Image by Daniel Nebreda from Pixabay

Gestational diabetes (or GDM) is a type of diabetes that appears only during pregnancy. Once the baby is born it usually disappears. Although it doesn’t tend to produce many symptoms it can increase the risk of complications in pregnancy so pregnant women are tested for it to avoid problems. Women who’ve had GDM are also at greater risk of developing Type 2 diabetes later on, joining an estimated 4 million people who have the condition in the UK.

Diabetes happens either when someone’s pancreas is unable to produce enough of a chemical called insulin, or because the body stops responding to the insulin that is produced. We need insulin to help us make use of glucose: a kind of sugar in our food that gives us energy. In Type 1 diabetes (commonly diagnosed in young people) the pancreas pretty much stops producing any insulin. In Type 2 diabetes (more commonly diagnosed in older people) the problem isn’t so much the pancreas (in fact in many cases it produces even more insulin), it’s that the person has become resistant to insulin. The result from either ‘not enough insulin’ or ‘plenty of insulin but can’t use it properly’ is that glucose isn’t able to get into our cells to fuel them. It’s a bit like being unable to open the fuel cap on a car, so the driver can’t fill it with petrol. This means higher levels of glucose circulate in the bloodstream and, unfortunately, high glucose can cause lots of damage to blood vessels.

During a normal pregnancy, women often become a little more insulin-resistant than usual anyway. This is an effect of pregnancy hormones from the placenta. From the point of view of the developing foetus, which is sharing a blood supply with mum, this is mostly good news as the blood arriving in the placenta is full of glucose to help the baby grow. That sounds great but if the woman becomes too insulin-resistant and there’s too much glucose in her blood it can lead to accelerated growth (a very large baby) and increase the risk of complications during pregnancy and at birth. Not great for mum or baby. Doctors regularly monitor the blood glucose levels in a GDM pregnancy to keep both mother and baby in good health. Once taught, anyone can measure their own blood glucose levels using a finger-prick test and people with diabetes do this several times a day.It will save money but also be much more flexible for mothers.

In-depth screening of every pregnant woman, to see if she has, or is at risk of, GDM costs money and is time-consuming, and most pregnant women will not develop GDM anyway. PAMBAYESIAN researchers at Queen Mary have developed a prototype intelligent decision-making tool, both to help doctors decide who needs further investigation, but also to help the women decide when they need additional support from their healthcare team.

The team of computer scientists and maternity experts developed a Bayesian network with information based on expert knowledge about GDM, then trained it on real (anonymised) patient data. They are now evaluating its performance and refining it. There are different decision points throughout a GDM pregnancy. First, does the person have GDM or are they at increased risk (perhaps because of a family history)? If ‘yes’ then the next decision is how best to care for them and whether or not to begin medical treatment or just give diet and lifestyle support. Later on in the pregnancy the woman and her doctor must consider when it’s best for her to deliver her baby, then later she needs ongoing support to prevent her GDM from leading to Type 2 diabetes. Currently in early development work, it’s hoped that if given blood glucose readings, the GDM Bayesian network will ultimately be able to take account of the woman’s risk factors (like age, ethnicity and previous GDM) that increase her risk. It would use that information to predict how likely she is to develop the condition in this pregnancy, and suggest what should happen next.

Systems like this mean that one day your smartphone may be smart enough to help protect you and your unborn baby from future harm.

– Jo Brodie, Queen Mary University of London, Spring 2021

Download Issue 27 of the cs4fn magazine on Smart Health here.

This post and issue 27 of the cs4fn magazine have been funded by EPSRC as part of the PAMBAYESIAN project.

Bayes’ theorem as an algorithm

Thomas Bayes is famous for the theorem named after him: Bayes’ theorem. (See What are the chances of that?) It can be used in any situation where we want to calculate a more accurate probability of something given extra evidence. We will look at a version for our virus problem from there. For a graphical version of what this algorithm is doing see A graphical explanation of Bayes’ theorem

We want to know the probability that you have the virus (called the “posterior probability”), given that have you just tested positive. In that case Bayes’ theorem becomes:

The theorem tells us that the chance that a person who tests positive actually has the virus is just the number of people with the virus who test positive divided by the total number of people (with or without the virus) who test positive.

The theorem can be used as the basis of an algorithm to compute the new, more accurate probability that we are after. We will assume, to make things easier to follow, that we are considering a population of a thousand people. We get the following algorithm:

To calculate accurate probability that you have the virus after testing positive:

  • STEP 1: Calculate how many people BOTH have the virus AND test positive.
  • STEP 2: Calculate the number of people who will test positive (whether they have the virus or not).
  • STEP 3: Divide ANSWER 1) by ANSWER 2) to give the final answer of the probability you have the virus after testing positive.

Let’s work through it with the numbers from our example. Stay calm! This is going to get hairy if you are not a computer!

What do we know? Well, actually we need another little algorithm to do Step 1:

To calculate how many people BOTH have the virus AND test positive (answer to step 1):

  • STEP 1a: Calculate the probability that you will test positive if you do have the virus.
  • STEP 1b: Calculate the probability you have the virus BEFORE knowing the test result.
  • STEP 1c: Multiply ANSWER 1a by ANSWER 1b by 1000 (our population).
A question mark in a globe network on a digital background
Image by Gerd Altmann from Pixabay

This calculates the answer to Step 1 for us. We have said we have a test that is always positive if you do have the virus (in reality tests do get it wrong this way too but, to keep things simple, we will ignore that here). That means the answer needed for Step 1a is a probability of 1 (meaning it is 100 per cent certain that it gets the answer right if you have the virus).

What about Step 1b? That is the country-wide probability of having the virus we are starting with. Knowing nothing else about an individual we have said 1 in 200 people have the virus. That makes the answer needed for this step: 1 / 200, so probability, 0.005

We can now calculate Step 1c: We just multiply those two numbers 1 x 0.005 and multiply that by the total number of people: 1000. This gives the answer that five people out of the 1000 have the virus and test positive.

Step 2 is a bit more tricky: it is the number of people out of our 1000 who test positive. That includes all those with the virus but ALSO those that the test wrongly says have the virus when they don’t. We need to add the numbers for these two groups: those with the virus and those without.

To calculate the number of people who test positive (answer to step 2):

  • STEP 2a: Calculate the number of people who have the virus AND who test positive (This is just the answer from Step 1.)
  • STEP 2b: Calculate the number of people who do NOT have the virus AND who test positive.
  • STEP 2c: Add ANSWER 2a and ANSWER 2b together.

We have already worked out the first part (Step 2a). It is just the answer from Step 1, so we already know it is five people. Step 2b is calculated in a similar way to Step 1 as follows:

To calculate the number of people who do not have the virus AND who test positive (answer to step 2b):

  • STEP 2bi: Calculate the probability that you will test positive if you do NOT have the virus.
  • STEP 2bii: Calculate the probability you do not have the virus.
  • STEP 2biii: Multiple ANSWER 2bi by ANSWER 2bii and then by 1000 to give the number of people who do not have the virus but test positive.

We know the answer to Step 2bi, as we said there was a two per cent chance of the test telling you that you had the virus when you didn’t. That means the answer to this step is 2 / 100 = 0.02.

For Step 2bii, the probability a person does NOT have the virus, we just need to calculate the rest of the population excluding those with the virus. We said one in every 200 people have the virus. That means 199 in 200 do not have it. The answer to this step is therefore 199 / 200 = 0.995.

So, to work out Step 2biii to find out the number of people who do not have the virus but test positive: we multiply our two above answers 0.02 x 0.995, then multiply this by 1000. This gives answer 19.9: so about 20 out of the 1000 people are incorrectly told they have the virus.

We can now go back to Step 2c and add the answer from Step 2a (of those correctly told they have the virus) to that from Step 2b (those told they have the virus when they do not). This is 5 + 20, so 25 people in total are given a positive result. This is the answer to Step 2.

Finally, we can work out the overall, more accurate probability (Step 3). Divide the answer from Step 1, (five people), by the answer to Step 2 (25 people), to give the final probability as 5 / 25 = 0.2 or a 20 per cent chance you actually have the virus after testing positive.

Don’t forget we have just made up the numbers here to show the maths. Although no test is 100 per cent accurate, the current Covid tests can be confirmed with an additional test to give further evidence.

Norman Fenton and Paul Curzon, Queen Mary University of London, Spring 2021

Download Issue 27 of the cs4fn magazine on Smart Health here.

This post and issue 27 of the cs4fn magazine have been funded by EPSRC as part of the PAMBAYESIAN project.