

My friends and I had just left the cinema after seeing Jurassic Park (in 1993, so a long time ago!) when one of the group pointed out that it was a shame the film didn’t have any dinosaurs in. We all argued that it was full of dinosaurs… until the penny dropped. Of course, obviously, the film couldn’t have contained any real dinosaurs, it was all done with animatronics* and (the relatively new at that time) CGI or computer-generated imagery.
The artist Rene Magritte had the same idea with his famous painting called ‘The treachery of images‘ but mostly known as ‘This is not a pipe’ (or ‘Ceci n’est pas une pipe’ in French). His creation represents a pipe but as Magritte said – “could you stuff my pipe? No, it’s just a representation, is it not? So if I had written on my picture “This is a pipe”, I’d have been lying!”
How do you represent something on a computer screen (that’s not actually real) but make it look real?
[*animatronics = models of creatures (puppets) with hidden motors and electronic controls that allow the creatures to move or be moved]
Let’s talk teapots
Computers now assist film and television show makers to add incredible scenes into their productions, that audiences usually can’t tell apart from what’s actually ‘real’ (recorded directly by the camera from live scenes). All these amazing graphics are created by numbers and algorithms inside a computer that encode the instructions for what the computer should display, describing the precise geometry of the item to create. A mathematical formula takes data points and creates what’s known as a series of ‘Bezier curves‘ from them, forming a fluid 3D shape on-screen.
In the 1970s Martin Newell, a computer graphics researcher studying at the University of Utah, was working on algorithms that could display 3D shapes on a screen. He’d already used these to render in 3D the five simple geometric shapes known as the Platonic solids** and he wanted to test his algorithms further with a slightly more complex (but not too much!) familiar object. Over a cup of tea his wife Sandra Newell suggested using their teapot – an easily recognisable object with curved surfaces, a hole formed by the handle and, depending on where you put the light, parts of it can be lit or in shadow.
Martin created on graph paper a representation of the co-ordinates of his teapot (you can see the original here). He then entered those co-ordinates into the computer and a 3D virtual teapot appeared on his screen. Importantly he shared his ‘Utah teapot’ co-ordinates with other researchers so that they could also use the information to test and refine their computer graphic systems.
[**the teapot is also jokingly referred to as the sixth Platonic solid and given the name ‘teapotahedron’]
Bet you’ve seen the Utah teapot before
Over time the teapot became a bit of an in-joke among computer graphic artists and versions of it have appeared in films and TV shows you might have seen. In a Hallowe’en episode of The Simpsons***, Homer Simpson (usually just a 2D drawing) is shown as a 3D character with a small Utah teapot in the background. In Toy Story Buzz Lightyear and Woody pour a cup of tea from a Utah teapot and a teapot template is included in many graphics software packages (sometimes to the surprise of graphic designers who might not know its history!)
[***”The Simpsons Halloween Special VI”, Series 7 Episode 6]
Here’s one I made earlier
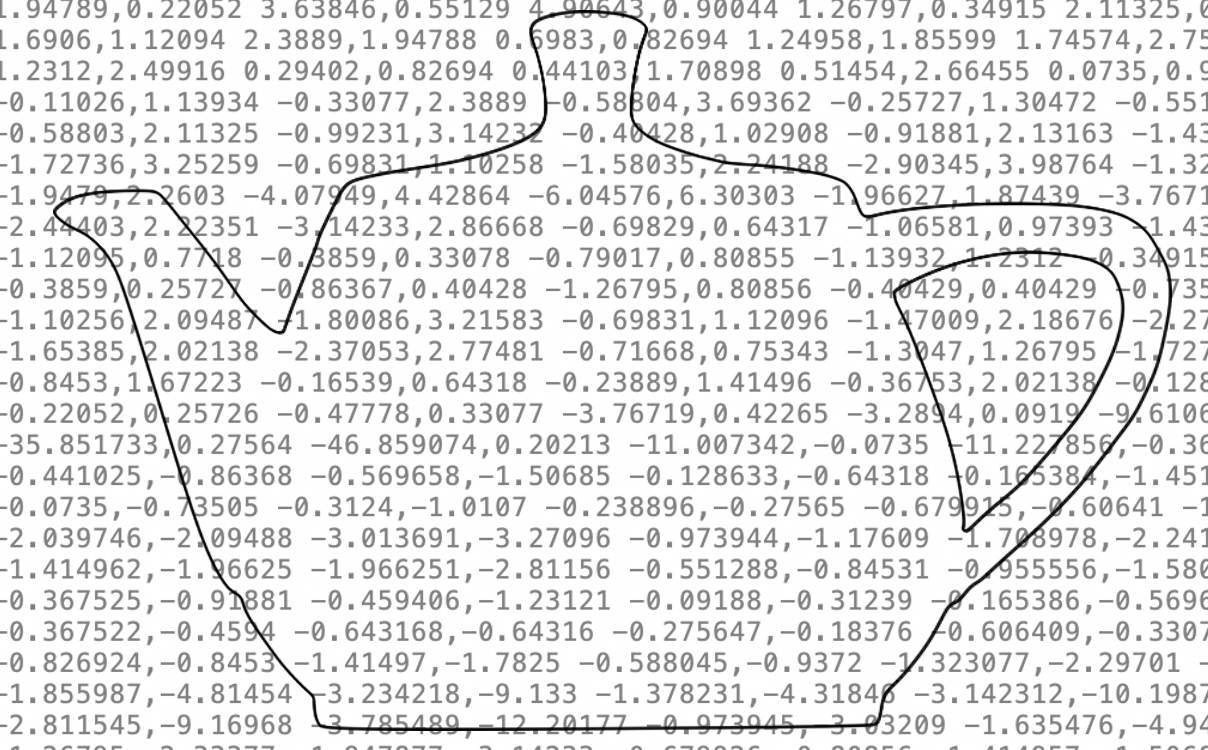
On the left is a tracing I made, of this photograph of a Utah teapot, using Inkscape’s pen tool (which lets me draw Bezier curves). Behind it in grey text is the ‘under the bonnet’ information about the co-ordinates. Those tell my computer screen about the position of the teapot on the page but will also let me resize (scale) the teapot to any size while always keeping the precise shape the same.
Create your own teapot, or other graphics
Why not have a go yourself, Inkscape is free to download (and there are lots of instructional videos on YouTube to show you how to use it). Find out more about Vector Graphics with our Coordinate conundrum puzzles and Vector dot-to-dot puzzles.
Do make yourself a nice cup of tea first though!
– Jo Brodie, Queen Mary University of London
More on …
- Computer Science and 3D [PORTAL]
- Coordinate conundrum puzzles and vector graphics
- Vector Dot-to-Dot Puzzles
- How Did A Teapot Revolutionise Computer Graphics Animation? (5 August 2024) Academyclass.com [EXTERNAL]
Watch …
Part of a series of ‘whimsical fun in computing’ to celebrate April Fool’s (all month long!).
Subscribe to be notified whenever we publish a new post to the CS4FN blog.
This blog is funded by EPSRC on research agreement EP/W033615/1.


