
A mathematical proof and a maths puzzle (but no hard sums, promise).
Thank you to everyone who’s been reading our Advent Calendar and said nice things about it and shared it with others. If you’re new to our pages you can see all our previous posts at the end.
We’re doing a post every day from the 1 – 25 December, loosely connected (if we can manage it!) to the theme suggested by the picture on the CS4FN Christmas Computing Advent Calendar.
Today’s picture on the Advent Calendar door is a Christmas pudding. Thanks to the phrase “the proof of the pudding is in the eating” (which I think means you have to eat all the chocolate puddings to know if they’re any good) I have chosen to match this picture with one of the CS4FN articles from the archives that is all about PROOF. Sadly we don’t seem to have any articles about pudding.

1. Proof without words
by Paul Curzon, QMUL. This article was originally published on the CS4FN website.
Graphic news images often help sway public opinion. Images of famine in Africa led to LiveAid, a massive relief effort in 1985. Images from war zones of civilians can be disturbing enough that war leaders lose or gain political support as a result (depending on who did the bad stuff). Images can have far more power than words to argue a case … to persuade.
Mathematical proofs are just arguments intended to persuade too. They aim to leave no element of doubt that some fact is true, not for emotional reasons but by logic. Mathematicians use mathematical notation – special symbols used in precise ways – to represent things in their proofs. That’s just a way of making sure the arguments are precise, with no room for doubt. Sometimes that can make them seem arcane and difficult to follow, though that’s only until you’ve learnt the mathematical language being used.
Mathematical proofs don’t have to use words and symbols though. In fact people have been presenting proofs as pictures at least since the Ancient Greeks, and just as with news images a diagrammatic proof can be much more persuasive. Sometimes just by looking at a diagram the truth of a fact can become obvious.
For example, here is a mathematical ‘fact’ we might want to prove:
“The square of any number is equal to the sum of consecutive odd numbers.”
That may sound a bit hairy. To get even hairier (if you aren’t a mathematician), we can write this precisely in mathematical notation as:
n2 = 1 + 3 + 5 + …+ (2n – 1)
Don’t worry about the notation though. Just look at the picture below. It shows what we mean by the fact and should persuade you it’s true.
The square of a number can be drawn as a picture of dots in a square. In other words one way to work out 102, say, is to create a square of dots with sides of length 10 and then count the dots. That’s why it’s called ‘squaring’!
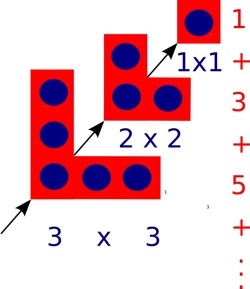
One way to draw the dots to make up a square is as follows. First draw one dot in the corner, then draw three dots in an L-shape round it, then draw 5 dots in an L-shape round that…and keep going. Add a new L-shape (including the first dot) 10 times, say, once for each dot along the side, and you get a square of size 10 with 100 dots altogether. Notice that at every step you still have a square, though. Also notice that each L-shape is 2 bigger than the one before. That’s because you can make it by adding one dot on the end of each arm of the last L-shape.
That means the number of dots in a square can be calculated by adding a sequence of odd numbers, one for each L-shape added: 1 + 3 + 5 + … As you add L-shapes you work up through squares of all sizes, so all squares can be made by adding odd numbers in this way.
We’ve just explained it in words, but actually it’s all in the picture, so it’s possible to see without needing the words at all.
At least it may be possible for a person to see perhaps, but what about a computer? Could a computer ‘see’ a proof from a diagram? Computers are now very good at helping humans do logical proof using mathematical notation – after all they work themselves by pushing ‘symbols’ about and following rules blindly, which is all logical proof is. Seeing a proof in a diagram is different altogether though…or is it?
Mateja Jamnik, of the University of Cambridge has been tackling this problem. In fact her system, DIAMOND, can already check diagrammatic proofs created by a person to see if they really do convince. With DIAMOND you could, for example, take a series of L shape pictures like ours above and build them up step-by-step giving squares of different sizes. The system can then pull out the structure of this step-by-step proof and from that automatically obtain the equation that it proves.
DIAMOND needs a person to develop a diagrammatic proof for it to check. In the future, if Mateja has her way, the computers will be devising new diagrammatic proofs themselves that then convince we humans.
2. Today’s puzzle – Logic and Proof FUNdamentals
(This text, by Paul Curzon, was originally published over several pages at the CS4FN website)
It is often said that being good at Maths is important for Computer Scientists. So what’s the link? Well a lot of the more obviously fun sides of maths are actually computer science too, like how to do puzzles such as Rubik’s Cubes, puzzles about weird and wonderful characters crossing rivers, how to win at strategy games, and doing Sudoku. The Maths you do in solving a Sudoku is the same kind of reasoning as that behind getting computer programs to work.
It is not so much the actual Maths you learn at school that is important. It is more that a similar way of thinking is important: logical reasoning. Doing Maths at school is one good way to start to learn how to think that way. So if you are good at Maths you will probably be good at Computer Science, though (using a bit of logical reasoning) that doesn’t mean the opposite follows of course.
Kakuro, Logic and Computer Science
To be a good computer scientist you have to enjoy problem solving. That is what it’s all about: working out the best way to do things. You also have to be able to think in a logical way: be a bit of a Vulcan. But what does that mean? It just means being able to think precisely, extracting all the knowledge possible from a situation just by pure reasoning. It’s about being able to say what is definitely the case given what is already known…and it’s fun to do. That’s why there is a Sudoku craze going on as I write. Sudoku are just pure logical thinking puzzles. Personally I like Kakuro better. They are similar to Sudoku, but with a crossword format.
What is a Kakuro?
A Kakuro is a crossword-like grid, but where each square has to be filled in with a digit from 1-9 not a letter. Each horizontal or vertical block of digits must add up to the number given to the left or above, respectively. All the digits in each such block must be different. That part is similar to Sudoku, though unlike Sudoku, numbers can be repeated on a line as long as they are in different blocks. Also, unlike Sudoku, you aren’t given any starting numbers, just a blank grid.
Where does logic come into it? Take the following fragment:
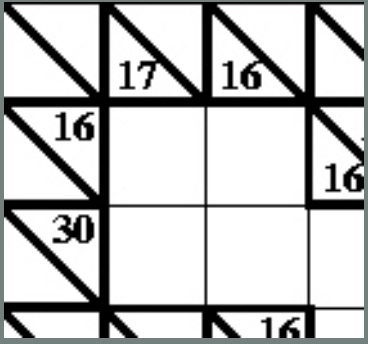
There is a horizontal block of two cells that must add up to 16. Ways that could be done using digits 1-9 are 9+7, 8+8 or 7+9. But it can’t be 8+8 as that needs two 8s in a block which is not allowed so we are left with just two possibilities: 9+7 or 7+9. Now look at the vertical blocks. One of them consists of two cells that add up to 17. That can only be 9+8 or 8+9. That doesn’t seem to have got us very far as we still don’t know any numbers for sure. But now think about the top corner. We know from across that it is definitely 9 or 7 and from down that it is definitely 9 or 8. That means it must be 9 as that is the only way to satisfy both restrictions.
Kakuro image above by Paul Curzon / CS4FN.
A Kakuro for you to try
Here is a full Kakuro to try. The answer will be in tomorrow’s post.
Being able to think logically is important because computer programming is about coming up with precise solutions that even a computer can follow. To do that you have to make sure all the possibilities have been covered. Reasoning very much like in a Kakuro is needed to convince yourself and others that a program does do what it is supposed to.

Kakuro puzzle image above by Paul Curzon / CS4FN.

EPSRC supports this blog through research grant EP/W033615/1.

