Tony Stockman, who was blind from birth, was a Senior Lecturer at QMUL until his retirement. A leading academic in the field of sonification of data, turning data into sound, he eventually became the President of the “International Community for Auditory Display”: the community of researchers working in this area.
Traditionally, we put a lot of effort into finding the best ways to visualise data so that people can easily see the patterns in it. This is an idea that Florence Nightingale, of lady of the lamp fame, pioneered with Crimean War data about why soldiers were dying. Data visualisation is considered so important it is taught in primary schools where we all learn about pie charts and histograms and the like. You can make a career out of data visualisation, working in the media creating visualisations for news programmes and newspapers, for example, and finding a good visualisation is massively important working as a researcher to help people understand your results. In Big Data a good visualisation can help you gain new insights into what is really happening in your data. Those who can come up with good visualisations can become stars, because they can make such a difference (like Florence Nightingale, in fact)
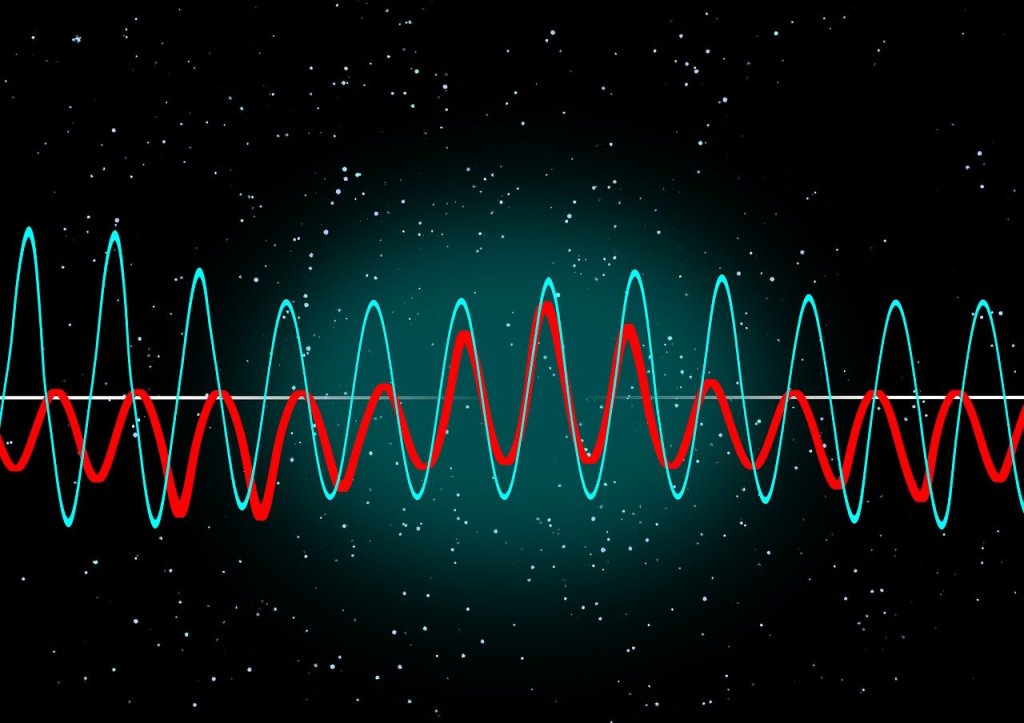
Many people of course, Tony included cannot see, or are partially sighted, so visualisation is not much help! Tony therefore worked on sonifying data instead, exploring how you can map data onto sounds rather than imagery in a way that does the same thing.: makes the patterns obvious and understandable.
His work in this area started with his PhD where he was exploring how breathing affects changes in heart rate. He first needed a way to both check for noise in the recording and then also a way to present the results so that he could analyse and so understand them. So he invented a simple way to turn data into sound using for example frequencies in the data to be sound frequencies. By listening he could find places in his data where interesting things were happening and then investigate the actual numbers. He did this out of necessity just to make it possible to do research but decades later discovered there was by then a whole research community by then working on uses of and good ways to do sonification,
He went on to explore how sonification could be used to give overviews of data for both sighted and non-sighted people. We are very good at spotting patterns in sound – that is all music is after all – and abnormalities from a pattern in sound can stand out even more than when visualised.
Another area of his sonification research involved developing auditory interfaces, for example to allow people to hear diagrams. One of the most famous, successful data visualisations was the London Tube Map designed by Harry Beck who is now famous as a result because of the way that it made the tube map so easy to understand using abstract nodes and lines that ignored distances. Tony’s team explored ways to present similar node and line diagrams, what computer scientist’s call graphs. After all it is all well and good having screen readers to read text but its not a lot of good if all it tells you reading the ALT text that you have the Tube Map in front of you. And this kind of graph is used in all sorts of every day situations but are especially important if you want to get around on public transport.
There is still a lot more to be done before media that involves imagery as well as text is fully accessible, but Tony showed that it is definitely possible to do better, He also showed throughout his career that being blind did not have to hold him back from being an outstanding computer scientists as well as a leading researcher, even if he did have to innovate himself from the start to make it possible.
More on …
- Shh! Can you hear that diagram?
- Computing and disability stars [PORTAL]
- Data Visualisation and Sonification [PORTAL]
- An interview with Tony Stockman for ICAD [EXTERNAL]
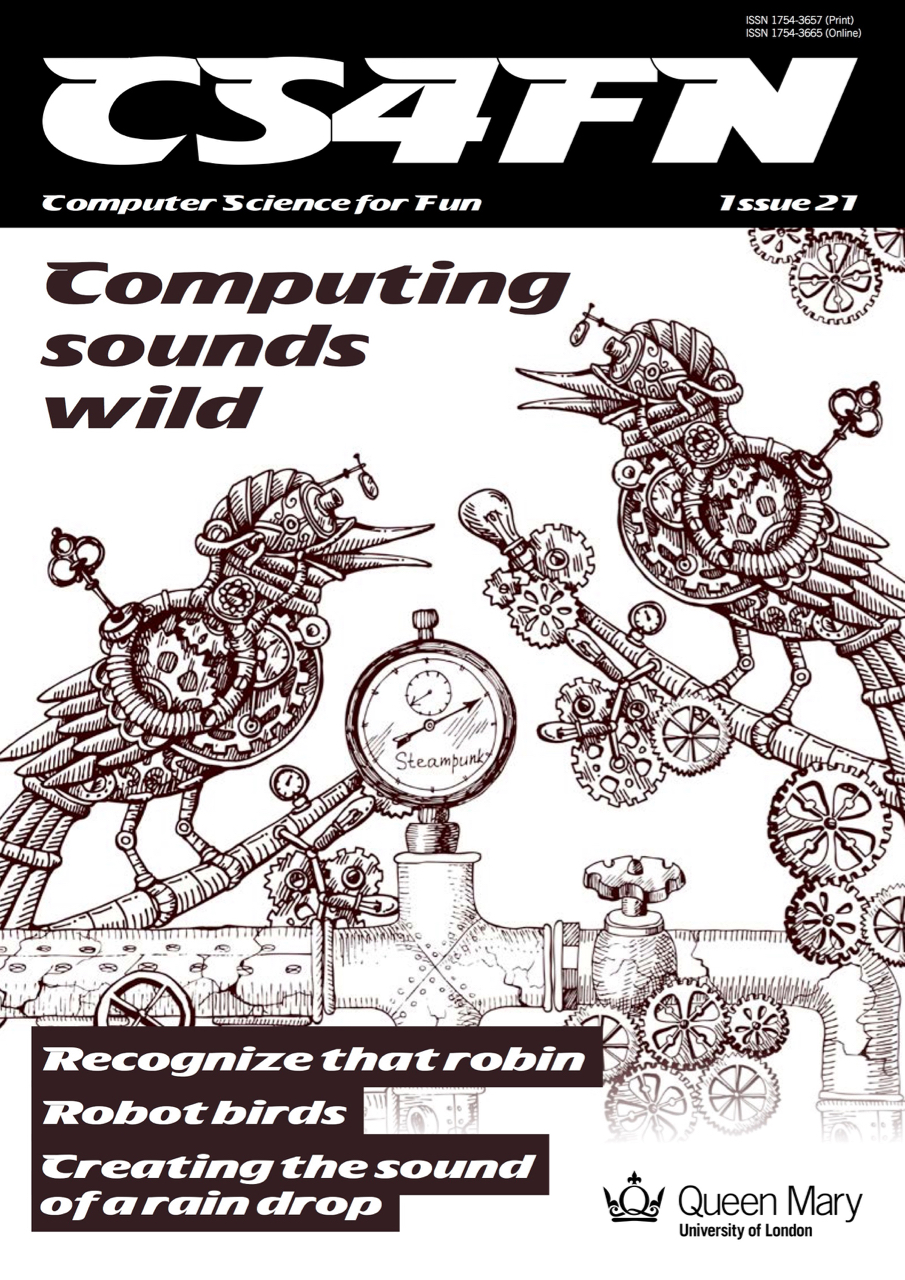
Related Magazine …

Subscribe to be notified whenever we publish a new post to the CS4FN blog.
This blog is funded by EPSRC on research agreement EP/W033615/1.