Unicode is the way that computers represent characters in a way that means all human languages (and some alien ones like Klingon) can be represented on a computer. It is just a code mapping characters to numbers, and it replaced the earlier American ASCII code that only allowed for the latin alphabet as used in American english. It means that computers can display and letter or character from any language from Japanese to Egyptian Hieroglyphs.
So where does poo come in? Well, the Egyptians had a hieroglyph for it, so unicode has a number for it. There’s even more unicode poo in the emoji character set but the Egyptians got there 1000s of years earlier. Here is how the Ancient Egyptians wrote or carved poo:
You can add any unicode character to a web page by including it in the html by putting &#x before the hexadecimal number corresponding to the unicode number of the character and following it by a semicolon so the Egyptian hieroglyph for excrement is written in html above as 𓄽
To write the heiroglyph for one of my favourites, an Egyptian Vulture, you use 𓄿 for example (it is also used to represent the letter aleph so a sound like our a when spelling out words).
𓄿
(If you don’t see the hieroglyphs it may just be that your browser can’t cope with unicode, try a different one!).
How data is represented is an important part of computer science. There are lots of ways numbers can be represented. Choosing a good representation can make things easier or harder to do.The Ancient Egyptians had a simple way using hieroglyphs (symbols). It is similar to Roman Numerals but simpler.
They represented numbers 1 to 9 with a hieroglyph with that number of straight lines. They arranged them into patterns (a bit like we do dots on a dice). The patterns make them easier to recognise. They used an upside down U shape for 10, two of these for 20, and so on. Their symbol for 10 also meant a “cattle hobble”. They then had a new symbols for each power of 10 up to a million. So 100 is the hieroglyph for a coil of rope.
Image by CS4FN
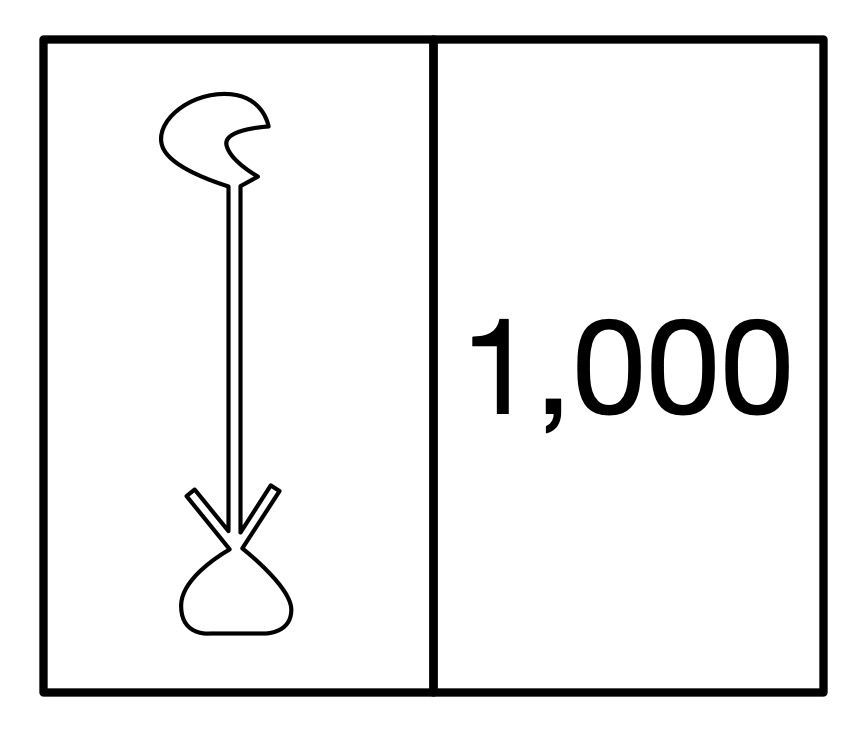
The hieroglyph for the number 1000 was a water lily.
The ancient Egyptian way to write 1000 was a hieroglyph of a waterlily. Image by CS4FN
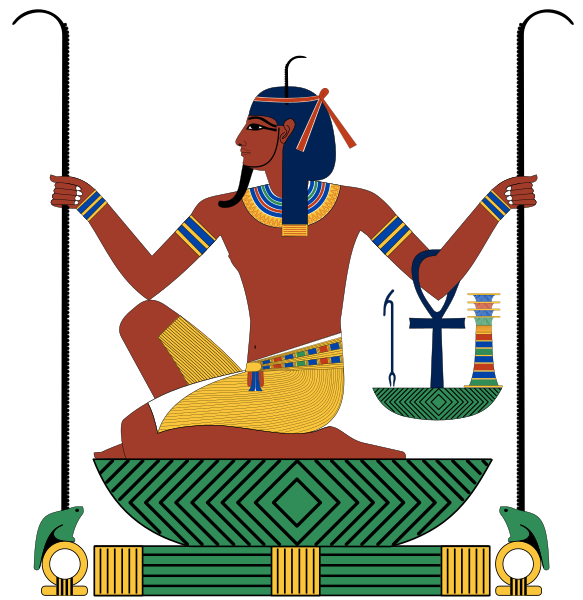
The hieroglyph for a million, which also rather sensible meant ‘many’, was just the hieroglyph of the god Hey who was the personification of eternity.
To make a number you just combined the hieroglyph for the ones, tens, hundreds and so on.
The Ancient Egyptian number system makes it very easy to write numbers and to add and subtract numbers. Big numbers are fairly compact, though take up more space than our decimals. It is easy to convert a tally representation into this system too. More complicated things like multiplication are harder to do. Computers use binary representation because they make all the main operations easy to do using logic. Ultimately it is all about algorithms. The Egyptians had easy to follow algorithms for addition and subtraction to go with their number representation. We have devised algorithms that allow computers to do all the calculations they do as quickly as possible using a binary representation
Paul Curzon, Queen Mary University of London
To do…
Try doing some sums as an Ancient Egyptian would – without converting to our numbers. What is the algorithm for adding Egyptian numbers? Do multiplication using a repeated addition algorithm – to do 3 x 4 you 4 to zero 3 times.
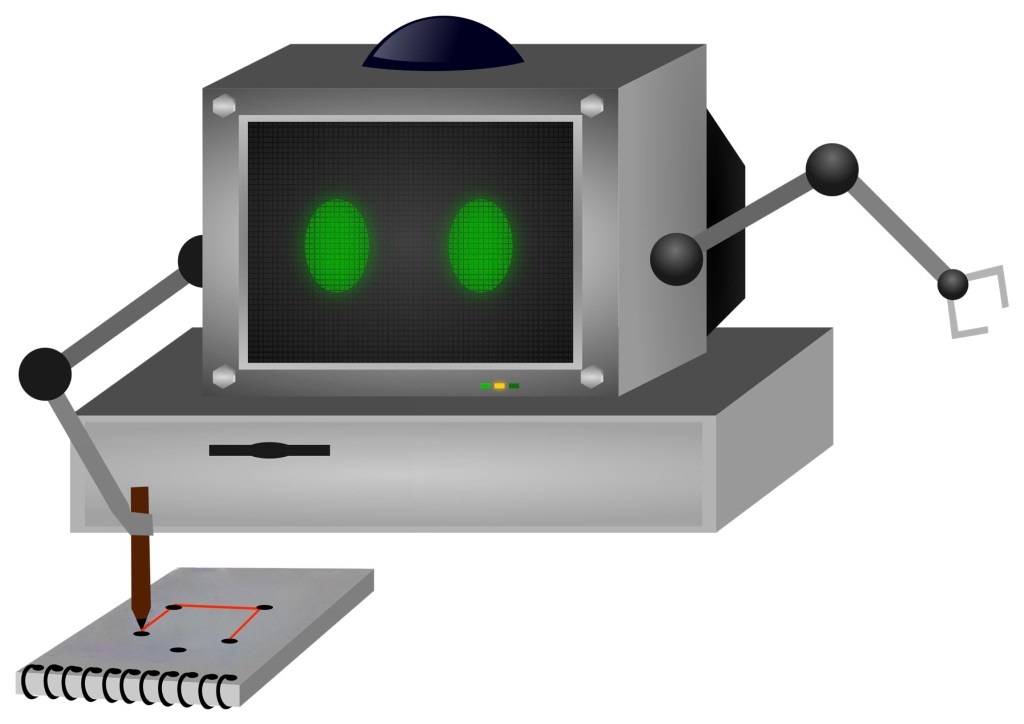
One way computers store images is as a set of points (as coordinates) that make up lines and shapes. This is the basis for the kind of computer graphics called Vector Graphics. You can explore the idea by doing coordinate conundrum puzzles. A coordinate conundrum is just a Vector Graphics Image to be drawn on paper.They are join-the-dot puzzles based on the idea. Can you recreate the original drawing?
Recreate a drawing from coordinates
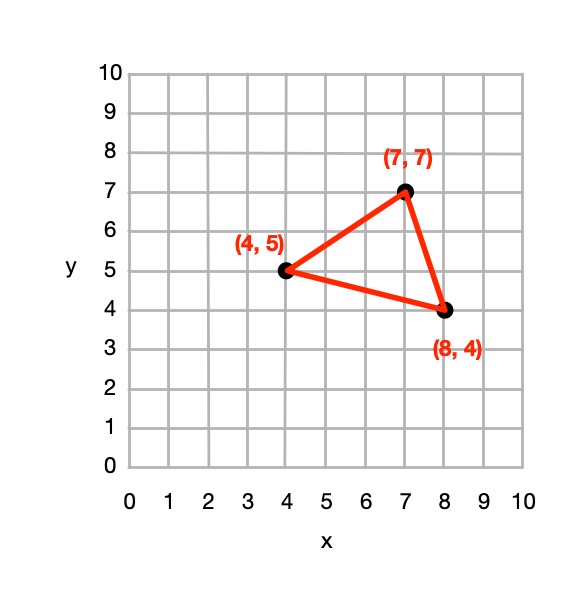
Points on a grid can be represented by pairs of numbers called coordinates. The first, x coordinate, says how far to go along horizontally. The second, y coordinate, says how far to go up, vertically. The numbers along the axes (along the bottom and up the side) of the grid give the distance in that direction. Draw the point at the place you end up at! So for example the coordinate (4,5) means go right from the origin 4 and up 5 and plot the point there.
Image by CS4FN
You can join any two coordinates with lines. If a series of lines join back to the original one then it make a shape (a polygon), which can be coloured in. For example, if we plot the points (4,5), (7,7 and (8,4) drawing lines between them and back to (4,5) we make a triangle.
Image by CS4FN
From 4 points we could define a square, rectangle or more general quadrilateral shape and so on.
So from a set of instructions telling you where to plot points, you can create a picture out of all the shapes and lines that make up the picture, giving colours for the lines or shapes.
This (and so these puzzles) is the basis of how programs in the language SVG (Scalable Vector Graphics) work to store a drawing as the instructions needed to recreate it. Drawing programs often store illustrations that the artists using them draw as an SVG program.
How to solve them
Each picture is made of shapes, each given by a colour and a list of the coordinates of its vertices (corners). For each shape:
1. Plot the list of (x,y) coordinates on the grid as dots.
2. Join the dots (which start and end at the same place) to make the shape.
3. Colour the shape you have made with the colour at the start of the list.
So, for example, if the first instruction starts: red (5,24) … that means plot the point 5 along and 24 up. It starts a new shape, coloured red, that ends at the same point.
If the series of points do not join back to the start then they represent coloured lines rather than a coloured shape,
Example: Semaphore flag
Image by CS4FN
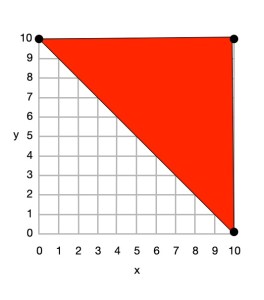
Here is a simple example to draw a red and yellow semaphore flag, given the shapes:
red (0,10) (10,10) (10,0) and back to (0,10)
yellow (0,10) (10,0) (0,0) and back to (0,10)
From this we can draw the picture.
Image by CS4FN
First we plot the points given for the red shape (a triangle), join the dots and colour it in.
red (0,10) (10,10) (10,0) and back to (0,10)
Image by CS4FN
Then we plot the points given for the yellow shape (another triangle), join the dots and colour it in.
yellow (0,10) (10,0) (0,0) and back to (0,10)
Do some puzzles yourself
Try the coordinate conundrum puzzles on our puzzle page either by printing off the puzzle sheet or drawing on squared paper. Then read on to find out a little more the advantages of vector graphics.
From straight lines to curves
In these puzzles we have only used straight lines between points, but we could also include commands to create circles and curved lines between points based on the mathematical equation for the curve. SVG, the vector graphic programming language, has instructions for a variety of more complex kinds of lines and shapes like that.
Advantages and disadvantages of Vector Graphics
Recording images in this way as points, lines and shapes has several advantages over storing images as pixels:
we generally need far less space to store the image as we do not need to store a colour for thousands or even millions of pixels;
the images are mathematically accurate – a line is represented as a perfect straight line not a pixelated (staircase-like) line;
the images are scalable, meaning you can increase the size of an image, zooming in just by multiplying all the numbers involved by a scale factor (which is just a number giving the magnification you want). The resulting image is still mathematically perfect with straight lines still straight lines, for example, just bigger. For example, suppose we want to make a semaphore flag twice the size of our original. We just multiply all points by 2, for example giving red (0,20) (20,20) (20,0) and back to (0,20); yellow (0,20) (20,0) (0,0) and back to (0,20) and it gives an identical picture, just bigger. (Try plotting it and see!)
Disadvantages are:
Vector graphics are not a good way to represent photographs – digital cameras record the light at lots of points corresponding to pixels so naturally are stored as pixels (numbers that give the colour in that small square of the image). Trying to convert a photo to a vector image would be hard (needing algorithms to recognise shapes, for example). It would be a less natural and less accurate way of doing so.
With computer memory cheap, the advantages of using less storage are less important than they once were.
SVG: a graphics programming language
The programming language SVG records drawings in this way as instructions to draw shapes and lines based on points. It has some difference to our instructions though. For example the y-axis coordinates start at the top and work down. The principles are the same though, it is only the detail that differs.
One way to use logical thinking is to deduce new facts but then turn them into IF-THEN rules. They tell us an action to do IF something is true. For example: IF both cards are the same THEN shout SNAP! Once we have IF-THEN rules we can use them as the basis of a program. We can see how this works, and how it involves various computational thinking skills with a simple logical thinking puzzle.
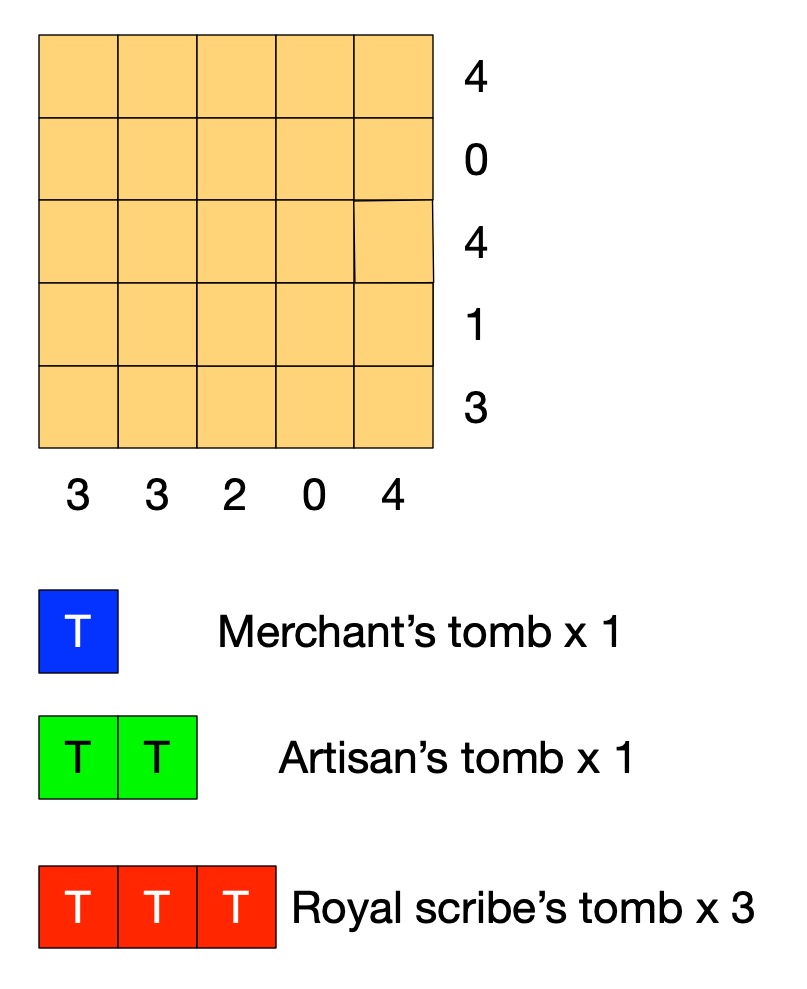
An Egyptian Survey puzzle
Image by CS4FN
Old records show that this area of the desert contains the tombs of 3 scribes (a large tomb covering 3 squares), 1 artisan (medium, 2 squares) and 1 merchant (small, 1 square).
A survey has gathered information of where the tombs could be. Each number tells you how many squares are part of a tomb in that row or column.
Tombs are not adjacent (horizontally, vertically or diagonally).
Can you work out where all the tombs are without further digging?
Solving Egyptian Survey puzzles
The instructions of the puzzle give us some simple facts such as that the number at the end of the row tells us the number of squares in that row holding tombs. On its own that does not tell us how to solve the puzzle. However, thinking logically about it we can draw simple logical conclusions so deduce new facts. For example, it is fairly simple to deduce the fact:
the number for a row being 0 IMPLIES there are no tombs in that row.
If we know there are no tombs in a row then we can mark each square of the row as empty. If we use X to mean nothing is in that square, then we can turn that deduced fact into an action. It means that we can do the following when trying to solve the puzzle:
IF the number on a row is 0
THEN put an X in all the squares of that row.
With that rule we can start to solve the puzzle just by following the rule. Find a row numbered 0 and put Xs there. We can create a similar rule for columns. Applying both these rules to our puzzle we get:
Image by CS4FN
Can you work out more rules before reading on?
Rules, rules, rules
What happens if the number of a row is more than 0? Knowing the number alone doesn’t help us much. We need to combine it with other information. The top row of the puzzle has the number 4, for example, but one of the squares already has a cross in it. That means the remaining 4 squares all must have tombs, which we will mark T. We can turn that into a rule:
IF the number for a row is 4 AND there are 4 empty squares in that row and an X
THEN put a T in all the empty squares of that row.
We can make similar rules for each number 1 to 4. We can then create similar rules for columns. Applying them once each to our puzzle gives us:
Image by CS4FN
We could also make a more general version of this rule
IF the number for a row is <n> AND there are only <n> empty squares in that row
THEN put a T in all the empty squares of that row.
This is what computer scientists call generalisation: a part of computational thinking. Instead of having lots of rules (or lines of code) for lots of similar situations, we create one simple but general one that covers all the cases. We can of course apply rules more than once, so as you probably noticed we can apply our row rule once more. In effect our rules live inside a loop and we keep trying them in sequence for as long as we find a rule that makes a difference.
Image by CS4FN
Now one of the rows has the number 1, but we have already marked a tomb in a square of that row. That gives us another rule.
IF the number for a row is 1 AND there is already 1 tomb marked in that row
THEN put an X in all the empty squares of that row.
This gives us:
Image by CS4FN
Similar rules apply for other numbers so we could also make a general version of this rule too.
IF the number for a row is <n> AND there are already <n> tombs marked in that row
THEN put an X in all the empty squares of that row.
Now, applying a column version of the last general rule and we can mark an X in the last square for column with 2 tomb squares.
Image by CS4FN
We need one last rule for this puzzle:
IF the number for a row is <n> AND the number of spaces + the number of 0s is <n>
THEN put a T in all the empty squares of that row.
This is actually an even more general version of our second rule (it is the case where the number of Ts is 0, so could replace that rule with this new one.
Applying it finally solves the puzzle:
Image by CS4FN
If we put our rules together then they become the basis of an algorithm (so program) for solving the puzzles and in creating them from deduced facts we are doing algorithmic thinking. IF-THEN instructions along with sequencing and loops are the basis of all programs. Here we create a sequence of the rules to try in order and put them inside a loop so that we keep trying them until none apply or we have solved the puzzle. There is a style of programming where all a program is is a series of IF-THEN rules – with looping happening implicitly.
Algorithms are just rules to follow that guarantee a result (here solving the puzzle). It is only an algorithm if it guarantees to always work. To solve any (solvable) Egyptian Survey puzzle like this we would need yet more rules: we would need more more rules for it to be an algorithm for solving all puzzles. Making sure algorithms cover all possibilities is one of the harder parts of algorithmic thinking – bugs in programs are often there because the programmer didn’t manage to cover every possibility. In our case we could write a program based on our limited rules. We would just need to include an extra rule that quits (admitting defeat and saying that the program cannot solve the puzzle) if no rule applies.
Perhaps you can work out all the rules (so an algorithm) needed to solve any of these puzzles! All you need are the instructions for the game, some logical thinking to deduce new facts, some algorithmic thinking to turn them into rules, and an ability to generalise so you have a small number of rules … computational thinking skills in fact.
The Romans were great at counting and addition but they were absolutely pants at multiplication. It wasn’t because they were stupid. It was because they hadn’t invented a good way to represent numbers, and that meant they needed really convoluted algorithms.
The Roman system is based on an earlier really simple way of writing numbers. You just put a line for each thing you’ve counted. Its probably the way shepherds kept count of sheep, drawing a line for each sheep. Those lines turned into the Roman letter I. To add 1 to a number you just add another I. You count: I, II, III, and so on and it makes counting easy.
This system is called unary – whereas binary involves counting with two symbols, 1 and 0, in unary you only have one symbol to count with. Addition in unary is easy too at least for small numbers. Take the first number and add on the end all the Is for the second and you’ve got the answer number. This is exactly the way we all start doing addition on our fingers.To add 2+3, hold up 2 fingers (II) then hold up another three fingers (III) and you have the answer (IIIII).
This is fine for small numbers but it gets a bit tedious as the numbers increase (and you run out of fingers!) Comparing numbers is easy in principle – do you have the same number of Is, but hard in practice for large numbers. We can’t keep all those Is in our head so a large number is hard to think about. To get round this the Romans invented new letters to stand for groups of Is. This is what we do when we tally numbers making a crossbar for every fifth number we count. It helps us keep track of larger numbers. The Romans invented a whole bunch of symbols to help: so for example in the Roman numeral system, V stands for 5 (IIIII), X stands for 10, L for 50, C for 100, D for 500 and M for 1000. They had invented a new way to represent numbers.
This makes it much easier to write and compare larger numbers. Now when counting and you get up to 5 you just replace all those Is with a V and then carry on adding Is: VI, VII, VIII, VIIII. Then you get to VIIIII (10) so replace it all with an X, starting again adding a new lot of Is: XI, XII, XIII, XIIII, XV, and so on. Counting large numbers is now a bit more involved – the algorithm involves more than just adding an I on the end, but it is much more convenient. The addition algorithm has now become more complicated, though it is still fairly simple too. Take any two numbers to add like VII and VIII and string them together: VIIVIII. Now group together the same letters: VVIIIII. Anywhere you have enough to replace symbols with the next character do so. VV can be replaced by X and IIIII can be replaced by V to give XV in the above. Keep making replacements until you can make no more. Put the symbols in order from largest to smallest symbol and you have your answer.
Now the Romans were obviously a bit lazy as bored with writing even four Is in a row they sometimes introduced a new set of abbreviations, so that IIII became IV and VIIII became IX. Putting a smaller symbol (like I) before a larger one (like X) instead of after meant subtract it to get the number. so IX means “one less than 10” or 9. Counting just got a tiny bit more complicated to get the advantage of writing fewer symbols. Addition now needs a more convoluted algorithm though. There are several ways to do it. The easiest is actually just to change the numbers to add to the simpler form (so IV goes back to IIII). You them do the addition that way, and convert back at the end. Addition just got that little bit harder, and all because of a change in representation.
Worse, doing any more complicated maths is even harder still using the Roman number representation. See if you can work out how to multiply Roman numbers. The Roman number system doesn’t help at all. The only really easy way is to just repeatedly add ( so III x VI is VI + VI + VI). That just isn’t practical for large numbers. Try it on XXIII x LXV1. There are other possible ways including one that is actually based on the binary multiplication algorithms computers use – multiplying and dividing repeatedly by 2. See if you can work out how to do it. Whatever way you do it, its clear that the number system the Romans chose made maths hard for them to do!
A good representation makes maths easy. A bad one makes it much harder to do
Luckily, Indian and Arabian scholars understood that the representation they used mattered. They invented, and spread, the Hindu-Arabic numbers and decimal system we use today. What is special about it is that rather than introducing new symbols for bigger and bigger numbers, the position of a symbol is used instead. As we go from nine to ten we go back to the start of our symbols, from 9 back to 0, but stick a 1 in a new 10s column to count how many 10s we have. Counting is still pretty easy but suddenly not only is the algorithm for addition straightforward but we can come up with fairly simple algorithms for multiplication and division too. They are the algorithms you learn at school – though as with any algorithm making sure you follow the steps exactly and don’t miss steps is hard for a human (unlike for a computer). That is why we tend to find learning maths hard at first and it gets easier the more we practice.
In fact Romans needing to do serious maths probably used a variation of an abacus representing numbers with stones. They would do a calculation on the abacus and then convert the answer back into the Roman number system. And guess what. The Roman Abacus uses columns to represent larger numbers in a very similar way to the Hindu-Arabic system. The Romans understood that representation matters too.
Sometimes things are hard to do just because we make them hard! The secret of coming up with good algorithms is often to come up with a good representation first. In programming too, if you come up with a good way to represent data, a good data structure, you can often then make it much easier to write an efficient program.
Subscribe to be notified whenever we publish a new post to the CS4FN blog.
This blog is funded by EPSRC on research agreement EP/W033615/1.
An early ‘magical’ (nearly headless) automaton from Ancient Greece
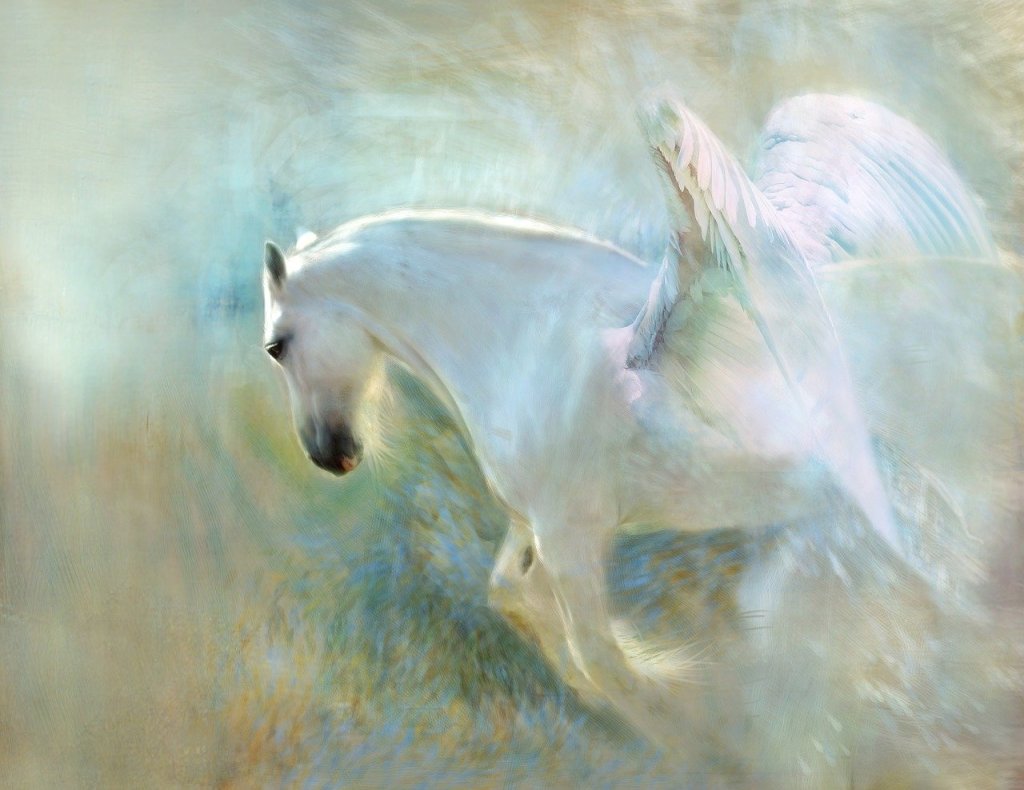
Stories of Ancient Greece abound with myths but also of amazing inventions. Some of the earliest automatons, mechanical precursors of robots, were created by the Ancient Greeks. Intended to delight and astound or be religious idols, they brought statues of animals and people to life. One story holds that Hero of Alexandria invented a magical, mechanical horse that not only moved and drank water, but was also impossible to behead. It just carried on drinking as you sliced a sword clean through its neck. The head remained solidly attached to body. Myth or Mystery? How could it be done?
The Ancient Greeks were clever. With many inventions we think of as modern, the Greeks got there first. They even invented the first known computer. Hero of Alexandria was one of the cleverest, an engineer and prolific inventor. Despite living in the first century, he invented the first known steam engine (long before the famous ones from the start of the industrial revolution), the first vending machine, a musical instrument that was the first wind-powered machine, and even the pantograph, a parallelogram structure used to make exact copies of drawings, enlarged or reduced. Did Hero invent a magical mechanical horse? He did, and you really could slice cleanly through its robotic neck with a sword, leaving the head in place.
Magic, myth and mystery
Queen Mary’s Peter McOwan was fascinated by magic and especially Hero’s horse as a child, and was keen to build one. When TEMI, a European project was funded he had his chance. TEMI aimed to bring more showmanship, magic and mystery to schools to increase motivation. By making lessons more like detective work, solving mysteries, they can be lots more fun. The project needed lots of mysteries, just like Hero’s horse, and artist Tim Sargent was commissioned to recreate the horse.
If you’re ever in Athens, you can see a version of Hero’s horse, as well as many other Greek inventions at Kotsanas Museum of Ancient Greek Technology.
How does it work?
The challenge was to create a version that used only Ancient Greek technology – no electricity or electromagnets, only mechanical means like gears, bearings, levers, cogs and the like. It was actually done with a clever rotating wheel. As the sword slices through a gap in the neck, it always connects head and body together first in front, then behind the blade. Can you work out how it was done? See a video of the mechanism in action below, with Peter introducing it.
ssue 26 of the CS4FN magazine which is a memorial issue for *Peter McOwan, who died in June 2019. Peter, along with Paul Curzon, was one of the co-founders of CS4FN.
Subscribe to be notified whenever we publish a new post to the CS4FN blog.
This blog is funded by EPSRC on research agreement EP/W033615/1.
People have always been fascinated by automata: robot-style contraptions allowing inanimate animal and human figures to move, long before computers could take the place of a brain.
Records show they were created in ancient Egypt, China, and Greece. In the renaissance Leonardo designed them for entertainment, and more recently magicians have bedazzled audiences with them.
The island of Rhodes was a centre for mechanical engineering in Ancient Greek times, and the Greeks were great inventors who loved automata. According to an Ode by Pindar the island was covered with automata:
The cave where most of the Dead Sea Scrolls were found. Image by Effi Schweizer, Public Domain from wikimedia
Computer science and artificial intelligence have provided a new way to do science: it was in fact one of the earliest uses of the computer. They are now giving new ways for scholars to do research in other disciplines such as ancient history, too. Artificial Intelligence has been used in a novel way to help understand how the Dead Sea Scrolls were written, and it turns out scribes in ancient Judea worked in teams.
The Dead Sea Scrolls are a collection of almost a thousand ancient documents written several thousand years ago that were found in caves near the Dead Sea. The collection includes the oldest known written version of the Bible.
Researchers from the University of Groningen (Mladen Popović, Maruf Dhali and Lambert Schomaker) used artificial intelligence techniques to analyse a digitised version of the longest scroll in the collection, known as the Great Isaiah Scroll. They picked one letter, aleph, that appears thousands of times through the document, and analysed it in detail.
Two kinds of artificial intelligence programs were used. The first, feature extraction, based on computer vision and image processing was needed to recognize features in the images. At one level this is the actual characters, but also more subtly here, the aim was that the features corresponded to ink traces based on the actual muscle movements of the scribes.
The second was machine learning. Machine Learning programs are good at spotting patterns in data – grouping the data into things that are similar and things that are different. A typical text book example would be giving the program images of cats and of dogs. It would spot the patterns of features that correspond to dogs, and the different pattern of features that corresponds to cats and group each image into one or the other pattern.
Here the data was all those alephs or more specifically the features extracted from them. Essentially the aim was to find patterns that were based on the muscle movements of the original scribe of each letter. To the human eye the writing throughout the document looks very, very uniform, suggesting a single scribe wrote the whole document. If that was the case, only one pattern would be found that all letters were part of with no clear way to split them. Despite this, the artificial intelligence evidence suggests there were actually two scribes involved. There were two patterns.
The research team found, by analysing the way the letters were written, that there were two clear groupings of letters. One group were written in one way and the other in a slightly different way. There were very subtle differences in the way strokes were written, such as in their thickness and the positions of the connections between strokes. This could just be down to variations in the way a single writer wrote letters at different times. However, the differences were not random, but very clearly split at a point halfway through the scroll. This suggests there were two writers who each worked on the different parts. Because the characters were otherwise so uniform, those two scribes must have been making an effort to carefully mirror each other’s writing style so the letters looked the same to the naked eye.
The research team have not only found out something interesting about the Dead Sea Scrolls, but also demonstrated a new way to study ancient hand writing. With a few exceptions, the scribes who wrote the ancient documents, like the Dead Sea Scrolls, that have survived to the modern day, are generally anonymous, but thanks to leading-edge Computer Science, we have a new way to find out more about them.


