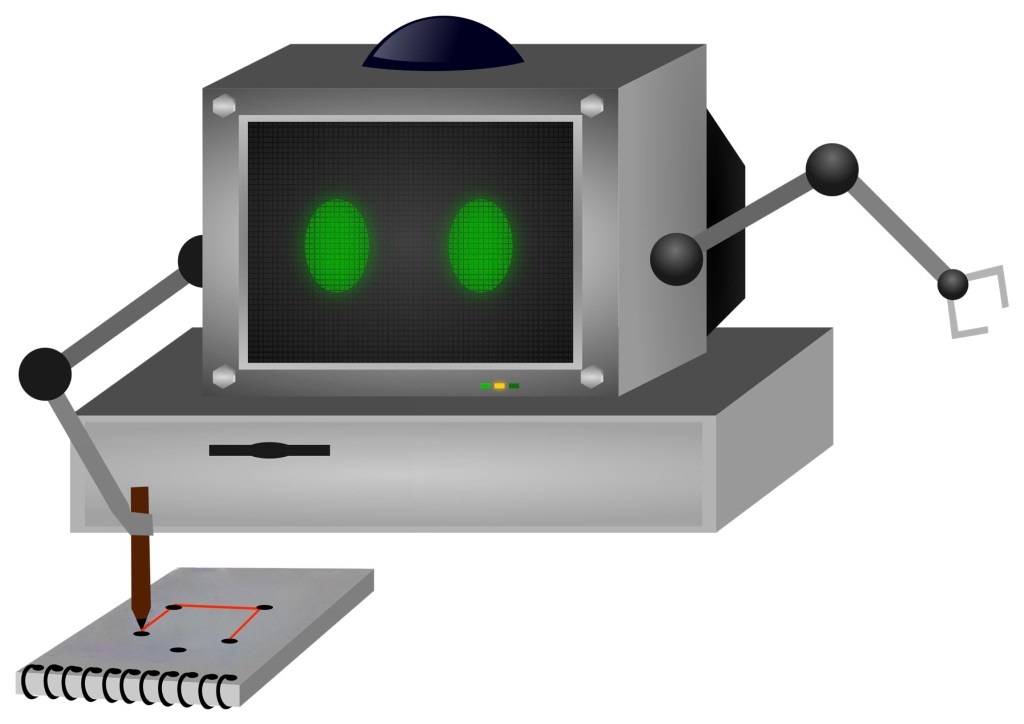
Image by Samson Vlad from Pixabay modified by CS4FN
One way computers store images is as a set of points (as coordinates) that make up lines and shapes. This is the basis for the kind of computer graphics called Vector Graphics. You can explore the idea by doing coordinate conundrum puzzles. A coordinate conundrum is just a Vector Graphics Image to be drawn on paper.They are join-the-dot puzzles based on the idea. Can you recreate the original drawing?
Recreate a drawing from coordinates
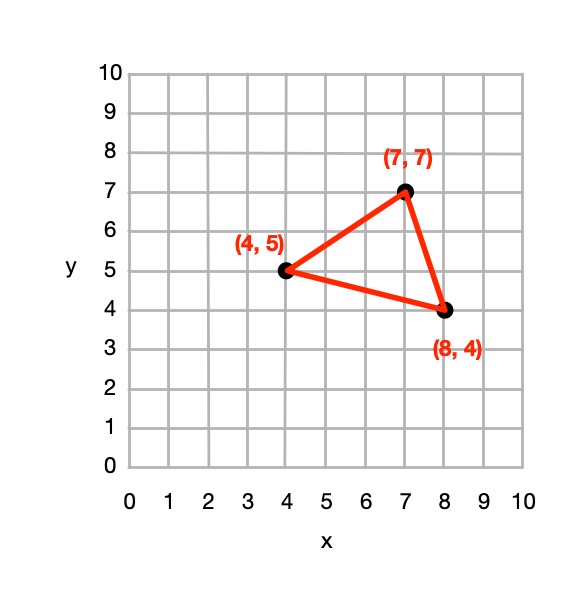
Points on a grid can be represented by pairs of numbers called coordinates. The first, x coordinate, says how far to go along horizontally. The second, y coordinate, says how far to go up, vertically. The numbers along the axes (along the bottom and up the side) of the grid give the distance in that direction. Draw the point at the place you end up at! So for example the coordinate (4,5) means go right from the origin 4 and up 5 and plot the point there.

You can join any two coordinates with lines. If a series of lines join back to the original one then it make a shape (a polygon), which can be coloured in. For example, if we plot the points (4,5), (7,7 and (8,4) drawing lines between them and back to (4,5) we make a triangle.
From 4 points we could define a square, rectangle or more general quadrilateral shape and so on.
So from a set of instructions telling you where to plot points, you can create a picture out of all the shapes and lines that make up the picture, giving colours for the lines or shapes.
This (and so these puzzles) is the basis of how programs in the language SVG (Scalable Vector Graphics) work to store a drawing as the instructions needed to recreate it. Drawing programs often store illustrations that the artists using them draw as an SVG program.
How to solve them
Each picture is made of shapes, each given by a colour and a list of the coordinates of its vertices (corners). For each shape:
1. Plot the list of (x,y) coordinates on the grid as dots.
2. Join the dots (which start and end at the same place) to make the shape.
3. Colour the shape you have made with the colour at the start of the list.
So, for example, if the first instruction starts: red (5,24) … that means plot the point 5 along and 24 up. It starts a new shape, coloured red, that ends at the same point.
If the series of points do not join back to the start then they represent coloured lines rather than a coloured shape,
Example: Semaphore flag
Here is a simple example to draw a red and yellow semaphore flag, given the shapes:
- red (0,10) (10,10) (10,0) and back to (0,10)
- yellow (0,10) (10,0) (0,0) and back to (0,10)
From this we can draw the picture.
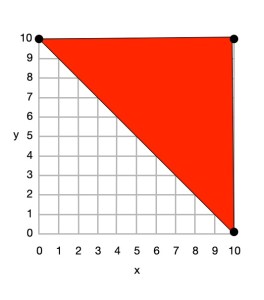
First we plot the points given for the red shape (a triangle), join the dots and colour it in.
- red (0,10) (10,10) (10,0) and back to (0,10)

Then we plot the points given for the yellow shape (another triangle), join the dots and colour it in.
- yellow (0,10) (10,0) (0,0) and back to (0,10)
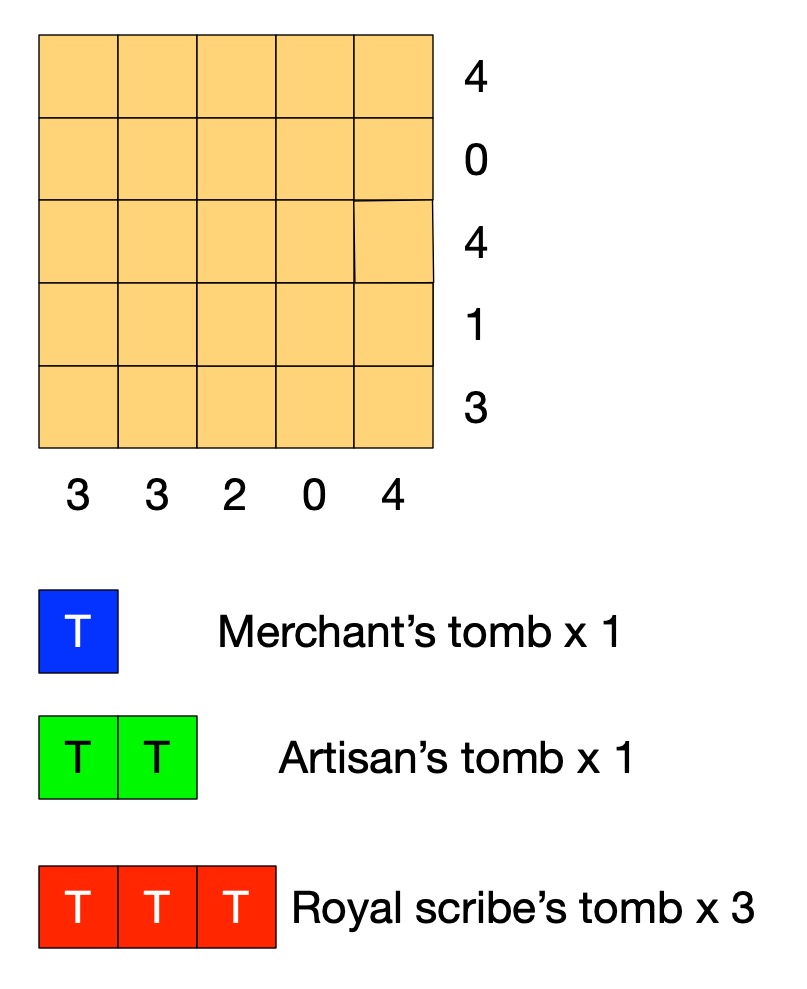
Do some puzzles yourself
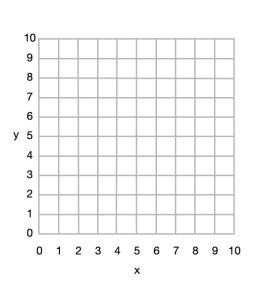
Try the coordinate conundrum puzzles on our puzzle page either by printing off the puzzle sheet or drawing on squared paper. Then read on to find out a little more the advantages of vector graphics.
From straight lines to curves
In these puzzles we have only used straight lines between points, but we could also include commands to create circles and curved lines between points based on the mathematical equation for the curve. SVG, the vector graphic programming language, has instructions for a variety of more complex kinds of lines and shapes like that.
Advantages and disadvantages of Vector Graphics
Recording images in this way as points, lines and shapes has several advantages over storing images as pixels:
- we generally need far less space to store the image as we do not need to store a colour for thousands or even millions of pixels;
- the images are mathematically accurate – a line is represented as a perfect straight line not a pixelated (staircase-like) line;
- the images are scalable, meaning you can increase the size of an image, zooming in just by multiplying all the numbers involved by a scale factor (which is just a number giving the magnification you want). The resulting image is still mathematically perfect with straight lines still straight lines, for example, just bigger. For example, suppose we want to make a semaphore flag twice the size of our original. We just multiply all points by 2, for example giving red (0,20) (20,20) (20,0) and back to (0,20); yellow (0,20) (20,0) (0,0) and back to (0,20) and it gives an identical picture, just bigger. (Try plotting it and see!)
Disadvantages are:
- Vector graphics are not a good way to represent photographs – digital cameras record the light at lots of points corresponding to pixels so naturally are stored as pixels (numbers that give the colour in that small square of the image). Trying to convert a photo to a vector image would be hard (needing algorithms to recognise shapes, for example). It would be a less natural and less accurate way of doing so.
- With computer memory cheap, the advantages of using less storage are less important than they once were.
SVG: a graphics programming language
The programming language SVG records drawings in this way as instructions to draw shapes and lines based on points. It has some difference to our instructions though. For example the y-axis coordinates start at the top and work down. The principles are the same though, it is only the detail that differs.
Paul Curzon, Queen Mary University of London
More on …
- Coordinate conundrum puzzles
- Computational Thinking Puzzles
- Print free A4 graph paper (more paper sizes)
Magazines …

Subscribe to be notified whenever we publish a new post to the CS4FN blog.
This blog is funded by EPSRC on research agreement EP/W033615/1.