All previous posts -- Humanity’s Last Exam
No pause for breath
The complexity of searching to speak
Beatrice Worsley: pioneering programmer
Why ‘Correct’ Computers Can Be So Wrong
Johnny Ball’s ‘Two Wrongs Do Make a Right’ Trick
Wright of Derby: science from the shadows
Granite: games for good?
The Proof of Love
Music AI Kriss Kross Puzzle
How machines “hear” music
All the notes?
Musical Algorithms
The day the music didn’t die
Composing ancient Korean music
Separate your stems
Jamming with JAM_BOT – an AI musician
Can a program beatbox (using physics)?
You’ll be Bach! – create music with the Bach Google Doodle
Listening to the machines
Cyber Security at the movies: Catwoman
The art of animatronics, or how to build a believable dinosaur
Pseudocode Poems
The Decline and Fall of Ada: Who’s popular now?
Victorian volunteers needed – the start of citizen science
If: a computational literary criticism
Twenty one years ago we wondered what technology would still be here in the future (now!)
Great Fleas… a poem about recursion
Lego Computer Science: Programming Creativity
A wearable robot – computer-powered exoskeletons
The Knights Templar Cipher
DoodleDraw a snowflake
Lego Computer Science: sequence, selection and iteration
Unicode Poo
Instant 3×3 Magic Squares
Synthetic Speech
Film Futures: A Christmas Carol
Hear and … their magic square
Sounding out a Sensory Garden
Film Futures (Christmas Special): Elf
Scéalextric Stories
Tony Stockman: Sonification
Clapping Music
The Machine Stops: a review
Going Postal: A review
The Alien Cookbook
Shh! Can you hear that diagram?
Jerry Elliot High Eagle: Saving Apollo 13
Service Model: a review
Crystal ball coupons – what your data might be giving away
Hacking DNA
Password strength and information entropy
The robot always wins
He attacked me with a dictionary!
Ninja White Hat Hacking
RADAR winning the Battle of Britain
Transitional Automaton: a poem
Sea sounds sink ships
Shouting at Memory: Where Did My Write Go?
AI owes us an explanation
Perceptrons and the AI winter
Lego Computer Science: Algorithms and computational agents
Mary and Eliza Edwards: the mother and daughter human computers
The Digital Seabed: Data in Augmented Reality
An experiment in buoyancy
Ammonite propulsion of underwater robots
Film Futures: The Lord of the Rings
Why do we still have lighthouses?
The first Internet concert
Let the brain take the strain
Margaret Hamilton: Apollo Emergency! Take a deep breath, hold your nerve and count to 5
Pots fixing problematic acoustics
You cannot be serious! …Wimbledon line calls go wrong
An AI Oppenheimer Moment?
Dr Who? Dr You???
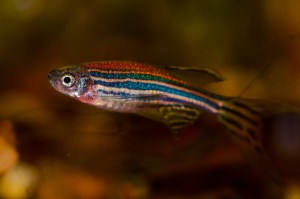
How did the zebra get its stripes?
If you go down to the woods today…
The Sweet Learning Computer: Learning Ladder
Signing Glasses
Sign Language for Train Departures
Was the first computer a ‘Bombe’?
Delia Derbyshire: Say it sounds like singing
The virtual Jedi
Bits with Soul (via a puzzle)
Film Futures: Brassed Off
Designing a planet’s road network
Film Futures: Tsotsi
Annie Easley: putting rockets into space
Torchwood: in need of some backup
Moon and Mind-Body Dualism
Bank holiday bunting!
Robot runners
Anne-Marie Imafidon’s STEMettes
The CS4FN Easter Egg Hunt
Bullseye! Mark Rober’s intelligent dart board
A Sea Hero Quest to understand our navigation skills
Robert Weitbrecht and his telecommunication device for the deaf
Debugging your sandwich maker
Making mistakes creatively – putting error messages to good use
You wouldn’t fall for that, would you?
Always check the text before sending to print!
Super-plant supercapacitors
The wrong trousers? Not any more!
Language-mangling rude word filters
Google’s “PigeonRank” and arty-pigeon intelligence
I’m (not) a little teapot
Broadband, by carrier pigeon
Music-making mates for Mortimer
Philippa Gardner bringing law and order to a wild west
Soft squidgy robots
An Wang’s magnetic memory
Aaron and the art of art
Sue Sentance: Teaching the world to program
Ancient Egyptian Numerals
Hiroshi Kawano and his AI abstract artist
Piet Mondrian and Image Representation
Maria Cunitz: astronomer and algorithmic thinker
Maria Kirch: human computer of the 1600s and 1700s
ELIZA: the first chatbot to fool people
Dina St Johnston: Kickstarting a software industry
The logic behind syntactic sugar
Turn Right in Tenejapa
Peter Landin: Elegance from Logic
A puzzle, spies … and a beheading
Designing an interactive prayer mat
A sound social venture: recognising birds
Oh no! Not again…
I wandered lonely as a mass of dejected vapour – try some AI poetry
Conjuring with logic: the remote control red-black mind meld
Adrian Stokes: Internet pioneer
Herman Hollerith: from punch cards to a special company
A handshaking puzzle
Tanaka Atsuko: an electric dress
Electric Dreams and Solid Light at the Tate Modern
My first signs
Join the crowd with swarm intelligence
Nemisindo: breaking the sound barrier
The logic piano
Mike Lynch: sequencing success
Superhero Syllogisms
Eating at Quonk: a tough puzzle?
From a handful of sand to a fistful of dollars
To be (CEO) or not to be (CEO)
The Blue Planet?
Mixing Research with Entrepreneurship: Find a need and solve it
Avoiding loneliness with StudyBuddy
Why is your Internet so slow?
Global Entrepreneurship Week
Wanna Be A Rock Star?
The illusion of good software design
Marc Hannah and the graphics pipeline
Claude Shannon: Inventing for the fun of it
The logic of Queens
Byte Queens
Sonifying zebrafish biology
Solving Railway Timetabling Problems with Data Visualisation
This quantum message will self-destruct in 10 seconds…
The Teleporting Robot
Cooking up computer style
Ask About Asthma
Working in Computer Science: An Autistic Perspective (Part 2)
Working in Computer Science: An Autistic Perspective (Part 1)
Scilly cable antics
Sarah Angliss: Hugo is no song bird
Bank holiday fun: website whimsy, and try your hand at making 3D pictures
Much ado about nothing
Double or nothing: an extra copy of your software, just in case
Navajo Code Talkers
Involving disabled people in the design of ICT tools and devices
Finding work experience, or a job in computer science
Photogrammetry for fun, preservation and research
Music & Computing: TouchKeys: getting more from your keyboard
Joyce Weisbecker: a teenager the first indie games developer?
Happy #WorldEmojiDay 2024 – here’s an emoji film quiz & some computer science history
Art Touch and Talk Tour Tech
Accessible Technology in the Voting Booth
The basics of Quantum Computing: Qubits
Gutta-Percha: how a tree launched a global telecom revolution
Even the dolphins use pocket switched networks!
NASA’s interstellar probe Voyager 1 went silent until computer scientists transmitted a fix that had to travel 15 billion miles!
Coordinate conundrum puzzles and vector graphics
Mary Ann Horton and the invention of email attachments
From Egyptian Survey puzzles to computational thinking
Pac-Man and Games for Girls
The invisible dice mystery – a magic trick underpinned by computing and maths
T. V. Raman and his virtual guide dogs
Designing for autistic people
Can you trust a smile?
Testing AIs in Minecraft
Computers that read emotions
Neurodiversity and what it takes to be a good programmer
The top 10 bugs
Do something computationally funny for money
Calculating Pi for Pi Day
Could AI end science?
Find your own time zone
The Social Machine of Maths
Software for Justice
Designing robots that care
A visit to the Turing Machine: a short story
Lego Computer Science: Turing Machines Part 3: the program
AMPER: AI helping future you remember past you
Lego Computer Science: Turing Machines Part 2: the controller
Lego Computer Science: Turing Machines Part 1: the tape
Singing bird – a human choir, singing birdsong
Eggheads: helping us to visualise objects and classes
Ethics – What would you do?
Collaborative community coding & curating
CS4FN Advent Calendar – Day 25 bonus Christmas crackers: have you ever seen this cracker joke?
CS4FN Advent 2023 – Day 25: Merry Christmas! Today’s post is about the ‘wood computer’
CS4FN Advent 2023 – Day 24: Santa’s Sleigh – track its progress through the skies
CS4FN Advent 2023 – Day 23: Bonus material – see “Santa’s sleigh” flying overhead
CS4FN Advent 2023 – Day 23: Father Christmas – checking his list, spotting the errors
CS4FN Advent 2023 – Day 22: wreaths and rope memory – weave your own space age computer
CS4FN Advent 2023 – Day 21: stars and celestial navigation
CS4FN Advent 2023 – Day 20: where’s it @? Gift tags and internet addresses
CS4FN Advent 2023 – Day 19: jingle bells or warning bells? Avoiding computer scams
CS4FN Advent 2023 – Day 18: cracker or hacker? Cyber security
CS4FN Advent 2023 – Day 17: pocket-switching networked reindeer
CS4FN Advent 2023 – Day 16: candy cane or walking aid: designing for everyone, human computer interaction
CS4FN Advent 2023 – Day 15: a candle: optical fibre, optical illusions
CS4FN Advent 2023 – Day 14: Why is your internet so slow + a festive kriss-kross puzzle
CS4FN Advent 2023 – Day 13: woolly hat: warming versus cooling
CS4FN Advent 2023 – Day 12: Computer Memory – Molecules and Memristors
CS4FN Advent 2023 – Day 11: the proof of the pudding… mathematical proof
Virtual reality goggles for mice
CS4FN Advent 2023 – Day 10: #AI – Holly, Ivy and Alexa – chatbots & the useful skill of file management. Plus win at noughts and crosses
CS4FN Advent 2023 – Day 9: gingerbread man – computing and ‘food’ (cookies, spam!), and a puzzle
CS4FN Advent 2023 – Day 8: gifts, and wrapping – Tim Berners-Lee, Right to Repair & another computing puzzle
CS4FN Advent 2023 – Day 7: Computing for the birds: dawn chorus, birds as data carriers and a Google April Fool (plus a puzzle!)
CS4FN Advent 2023 – Day 6: patterned bauble: tracing patterns in computing – printed circuit boards, spotting links and a puzzle for tourists
CS4FN Advent 2023 – Day 5: snowman: analog hydraulic computers (aka water computers), digital compression, and a puzzle
CS4FN Advent 2023 – Day 4: Ice skate: detecting neutrinos at the South Pole, figure-skating motion capture, Frozen and a puzzle
CS4FN Advent 2023 – Day 3: snowflakes – make your own six-sided HexaHexaFlexagon with our templates
CS4FN Advent 2023 – Day 2: Pairs: mittens, gloves, pair programming, magic tricks
CS4FN Advent 2023 – Day 1: Woolly jumpers, knitting and coding
Cartoons, comics and computer games – Ada Lovelace’s graphic novel
Blade: the emotional computer.
Exploring mazes, inventing algorithms (part I)
Why the Romans were pants at maths
Beheading Hero’s mechanical horse
How far can you hear? Modelling distant birdsong.
Threads & Yarns – textiles and electronics
3D models in motion
Frequency Analysis for Fun
Keeping secrets on the Internet – encryption keeps your data safe
Composing from Compression
Balls, beams and quantum computers – performing calculations with patterns of light
Getting off the beach, fast
“A mob for the Earth”
Competitive Zen
Pit-stop heart surgery
Cyber Security at the movies: Rogue one (Part II: Authentication)
Happy World Emoji Day – 📅 17 July 2023 – how people use emoji to communicate and what it tells us about them 😀
Cyber Security at the movies: Rogue one (Part I: Physical Security)
When a chatbot acts as your “trusted” agent …
Nurses in the mist
Negligent nurses? Or dodgy digital? – device design can unintentionally mask errors
Screaming Headline Kills!!!
Putting your hand up a cow’s bottom
Bitten blue
Creating great game worlds
Hallucinating chatbots
Protecting your fridge
The gender shades audit
Playing the weighting game
Collecting mini-beasts and pocket monsters
“Tlahcuilo”, a visual composer
Follow those ants
The first computer wizard
A Godlike Heart
Mary Clem: getting it right
Black in Data
Reclaim your name
Al-Jazari: the father of robotics
Mark Dean: A PC Success
In space no one can hear you …
The last piece of the continental drift puzzle
Digital lollipop: no calories, just electronics!
The tale of the mote and the petrel
Fran Allen: Smart Translation
A gendered timeline of technology
Operational Transformation
Engineering a cloak of invisibility: manipulating light with metamaterials
Alexander Graham Bell: It’s good to talk
Manufacturing Magic
Solving problems you care about
Sameena Shah: News you can trust
Object-oriented pizza at the end of the universe
Stretching your keyboard – getting more out of QWERTY
Is ChatGPT’s “CS4FN” article good enough?
Understanding Parties
A machine wrote this post – OpenAi’s ChatGPT
Mood Gloves
What the real Pros say
Susan Kare: Icon Draw
Celebrating Jean Bartik: 1940s programmer
What’s that bird? Ask your phone – birdsong-recognition apps
Inspiring Wendy Hall
Barbara Liskov: Byzantine birthdays
Marissa Mayer: Lemons Linking 41 Shades of Blue – A/B Testing
Opinions, Opinions, Opinions
Joyce Wheeler: The Life of a Star
The Devil is in the Detail: Lessons from Animal Welfare? (Temple Grandin)
Ingrid Daubechies: Wiggly lines help catching crime
Mark Dean: An Inspiration
100,000 frames – quick draw: how computers help animators create
Edie Schlain Windsor and same sex marriage
Understanding matters of the heart
The Dark History of Algorithms
Lego Computer Science: Logic with Truth Tables
Lego Computer Science: Truth Tables
Jacquie Lawson: the multi-million pound greeting
Ludwig Wittgenstein: tautology and truth tables
Alan Turing’s life
Cognitive crash dummies
Chatbot or Cheatbot?
Daphne Oram: the dawn of music humans can’t play
Kimberly Bryant: Black Girls Code
Bringing people closer when they’re far away
Hedy Lamarr: The movie star, the piano player and the torpedo
Gary Starkweather: the laser printer and colour management
Lynn Conway: revolutionising chip design
Sorry to bug you: Grace Hopper
The first computer music
Swat a way to drive
Future Friendly: Focus on Kerstin Dautenhahn
The last speaker
The joke Turing test
The Chinese room: zombie attack!
The paranoid program
How does Santa do it?
Pepper’s Ghost: an 1860s illusion used in ‘head-up displays’
Making sense of squishiness – 3D modelling the natural world
Watching whales well – the travelling salesman problem
Recognising (and addressing) bias in facial recognition tech
Happy Hallowe’en
Devices that work for everyone
Facing up to ALL faces
Hidden Figures: NASA’s brilliant calculators
Writing together: Clarence ‘Skip’ Ellis
Mark Dean: An Inspiration
Freddie Figgers – the abandoned baby who became a runaway telecom tech star
Gladys West: Where’s my satellite? Where’s my child?
Kakuro, Logic and Computer Science
Cold hard complexity: learning to talk in nature’s language
Love your data
Delicious computing
Hiding in Skype
Naked Mole-Rats Go Digital – monitoring colonies remotely (while respecting their privacy)
The heart of an Arabic programming language
Escape from Egypt
Chocoholic Subtraction
Chocolate Turing Machines (edible computing)
Microwave health check
Microwave Racing
Can a computer tell a good story?
Patterns for Sharing
Your own electrical sea
Playing Bridge, but not as we know it – the sound of the Human Harp
Strictly Judging Objects
Cryptography: You are what you know
Cryptography: Shafi Goldwasser and the Zero Knowledge Proof
The First Law of Humans
Dressing it up
The Mummy in an AI world: Jane Webb’s future
The naked robot
Lego computer science: What is computation? (simple cellular automata)
Shirts that keep score
More Encrypted Deckchairs
Full metal jacket: the fashion of Iron Man
Lego computer science: binary
Let buttons be buttons
Encrypted Deckchairs
Back (page) to the drawing board
Tempest Prognosticator: look out, leeches!
Quipu: tie a knot in it
Bullseye! The intelligent dart board
The Ultimate (do nothing) machine
Simone Giertz: A pat on the shoulder
Christopher Strachey and the secret of being a Wizard Debugger
Sophie Wilson: Where would feeding cows take you?
The Hive at Kew
The beach, the missionary and my origin myth
Hoverflies: comin’ to get ya
Edge-notched cards and relational databases
The Wood Computer
Babbage’s barrels
Ada and the music machine
Ant Art
Ant Track Algorithms
Diamond Dogs: Bowie’s algorithmic creativity
The algorithm that could not speak its name
I Ching binary
Predicting the future: marble runs, binary and the I Ching
Mary Coombs, teashops and Leo the computer
A custard computer
The taming of the screw
Quicksilver memory
A storm in a bell jar
Pass the screwdriver, Igor
Babbage’s triumph over brutal reality
Nikola Tesla: the invisible genius
Babbage’s Adders
Making core rope memory
Core rope memory
An ode to technology
Swallow a slug-bot to catch a …
“The thundering engines vibrate throughout your body”
If the Beagle had landed…
Fencing the moon
Ada Lovelace in her own words
Dickens knitting in code
Understanding Ultron: A Turing test for world domination
April Fooling with computing – IP over avian carriers, PigeonRank
A Wookie for three minutes please
The cure that just folds away
Executable Biology
Lego computer science: Gray code
Lego computer science: representing numbers using position
Lego computer science: representing numbers
Lego computer science: compression algorithms
Lego computer science: pixel pictures
CS4FN Advent Calendar – bonus material: HexaFestiveFlexagons to make and colour in
Meet the chatbots
How to get a head in robotics
The machines can translate now
Letters from the Victorian Smog: Braille: binary, bits & bytes
Only the fittest slogans survive!
What are birds actually saying?
Stopping sounds getting left behind: the Bela computer
Ada Lovelace: Visionary
I know where your cat lives
The red sock of doom – trying to catch mistakes before they happen
Playing Tantrix: P=NP?
Emoticons and Emotions
Knitters and Coders: separated at birth?
Die another Day? Or How Madonna crashed the Internet
The Emoji Crystal Ball
Back (page) to health
Gadgets based on works of fiction
How do you solve a problem like arthritis?
Are you there yet?
So, so tired…
Is your healthcare algorithm racist?
Solving real problems with Bayesian networks
Diagnose? Delay delivery? Decisions, decisions. Decisions about diabetes in pregnancy
Bayes’ theorem as an algorithm
Cloudy with a chance of pain
A simple Bayesian network for having a virus
Here
A graphical explanation of Bayes theorem
What are the chances of that? The church minister’s hobby and clever machines
The ping pong vaccination programming challenge
Smart health: decisions, decisions, decisions
I’m feeling Moo-dy today
Standup Robots
Sabine Hauert: Swarm Engineer
What’s on your mind?
In a New York nanosecond
Hiding in Elizabethan Binary
The optical pony express
Smart bags
Punk robots learn to pogo
The computer vs the casino: Wearable tech cheating
Sick tattoos
One in the eye for wearable tech
Smart tablets (to swallow)
i-pickpocket
AI Detecting the Scribes of the Dead Sea Scrolls
Losing the match? Follow the science. Change the kit!
DragonflyAI: I see what you see
Studying Comedy with Computers
Every Breath You Take: Reclaim the Internet
Why would you accept inefficiency?
The Cyber-Security Honeypot
The very first computers
A recipe for programming
Florence Nightingale: rebel with a cause
The Tactful Watch
HMS Belfast: destroying the destroyer
Machines Inventing Musical Instruments
Return of the killer robot? Evil scientist?! Helpless woman?!?
Who invented Morse code?
Cyber Security at the Movies: Guardians of the Galaxy (Fail Secure security)